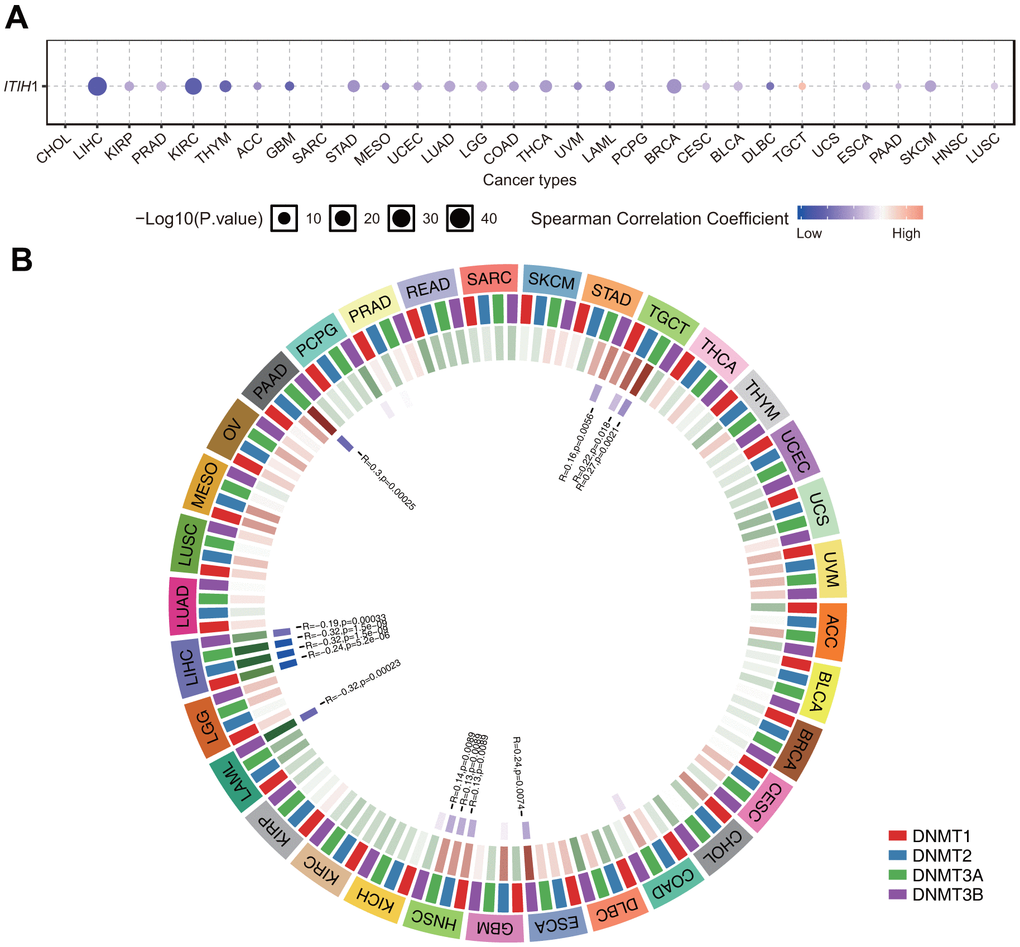
Figure 7.Relationship between methylation levels and ITIH1 mRNA expression level in various tumors in TCGA database. (A) Correlation between methylation and ITIH1 mRNA expression analyzed by the GSCA database. Blue dots indicates negative correlation and red indicates positive correlation. The darker the color, the higher the correlation. The size of the point represents the statistical significance, and the larger the size, the greater the significance. (B) Correlation between ITIH1 expression and the expression levels of four methyltransferases (DNMT1: red, DNMT2: blue, DNMT3A: green, DNMT3B: purple).