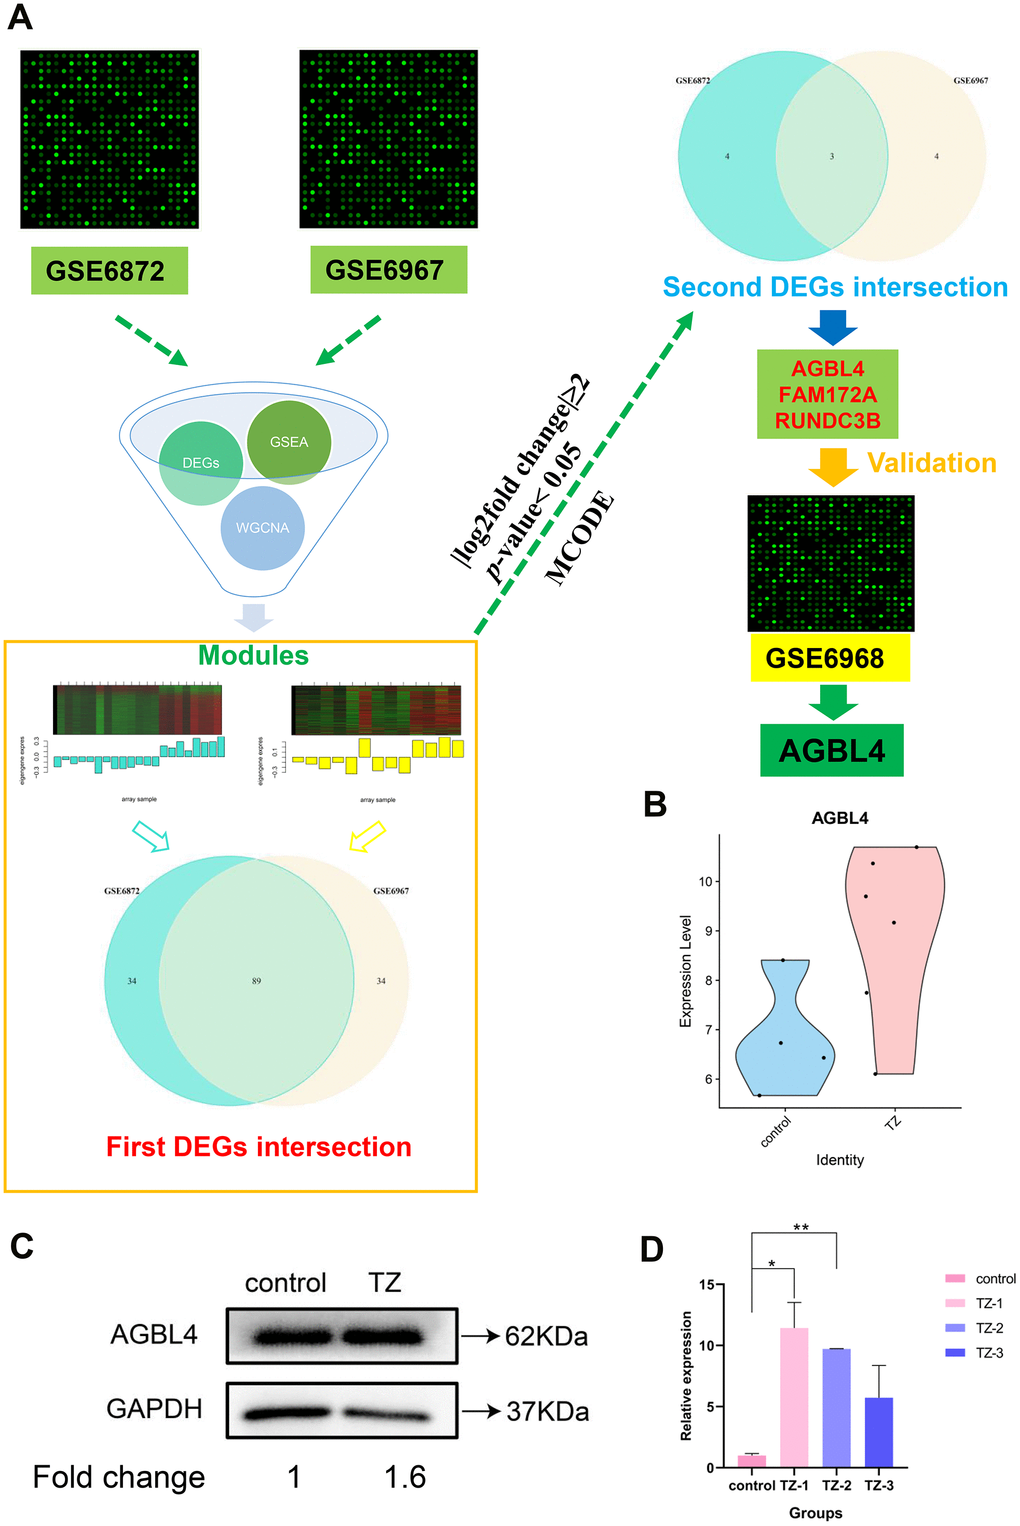
Figure 3.The flowchart of the whole analysis process and AGBL4 gene validation. (A) The flowchart of the whole analysis process. After collecting the datasets GSE6872 and GSE6967, we combined differentially expressed gene screening, GSEA analysis, and WGCNA analysis to narrow down the most relevant modules (separately colored with turquoise and yellow) between the two datasets. Subsequently, after two intersections, three DEGs were screened. Then, we substituted these three differentially expressed genes into the other dataset (GSE6968) for validation and found that only AGBL4 gene had an identical expression trend to the first two datasets (GSE6872 and GSE6967). (B) AGBL4 gene validation in another dataset GSE6968. TZ, teratozoospermia samples; control, healthy samples. (C) AGBL4 gene expression validation using western blotting. TZ, teratozoospermia samples; control, healthy samples. The fold change calculation was finished based on gray intensities of protein bands. (D) AGBL4 gene expression validation using qRT-PCR. TZ, teratozoospermia samples; control, healthy samples.