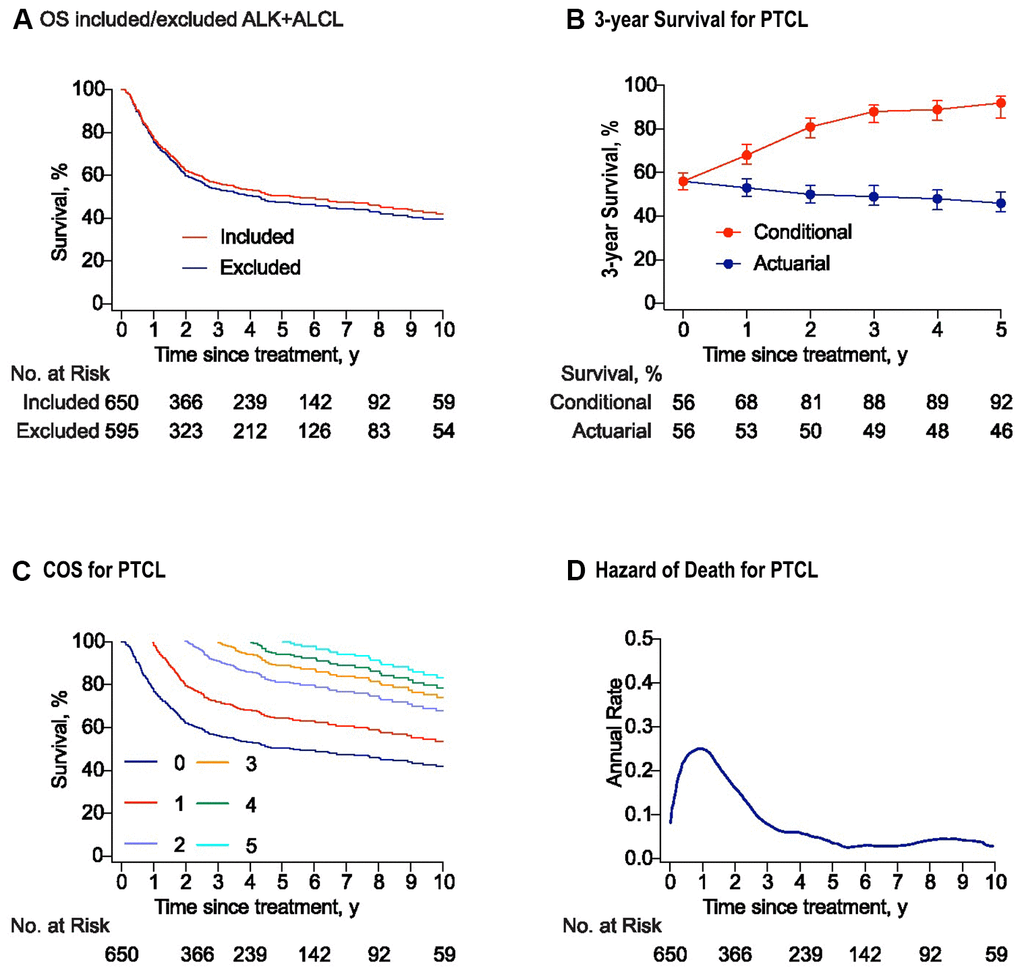
Figure 1.Survival and conditional survival curves for patients with peripheral T-cell lymphomas (PTCLs). (A) The overall survival curves for the whole study and the cohort with PTCL excluded anaplastic lymphoma kinase positive anaplastic large-cell lymphoma (ALK+ALCL). (B) Three-year conditional and 3-year actuarial survival with error bars of 95% confidence intervals (CIs) for the whole study cohort. For example, the 3-year actuarial survival rate at 2 years was the 5-year survival rate estimated at baseline. All the actuarial survival rates were calculated at the time point of starting treatment. (C) Conditional survival curves for patients who have survived for 1 year, 2 years, 3 years, 4 years, and 5 years from the time of treatment are shown. (D) Smoothed hazard plots for the annual rate of death for PTCLs since treatment.