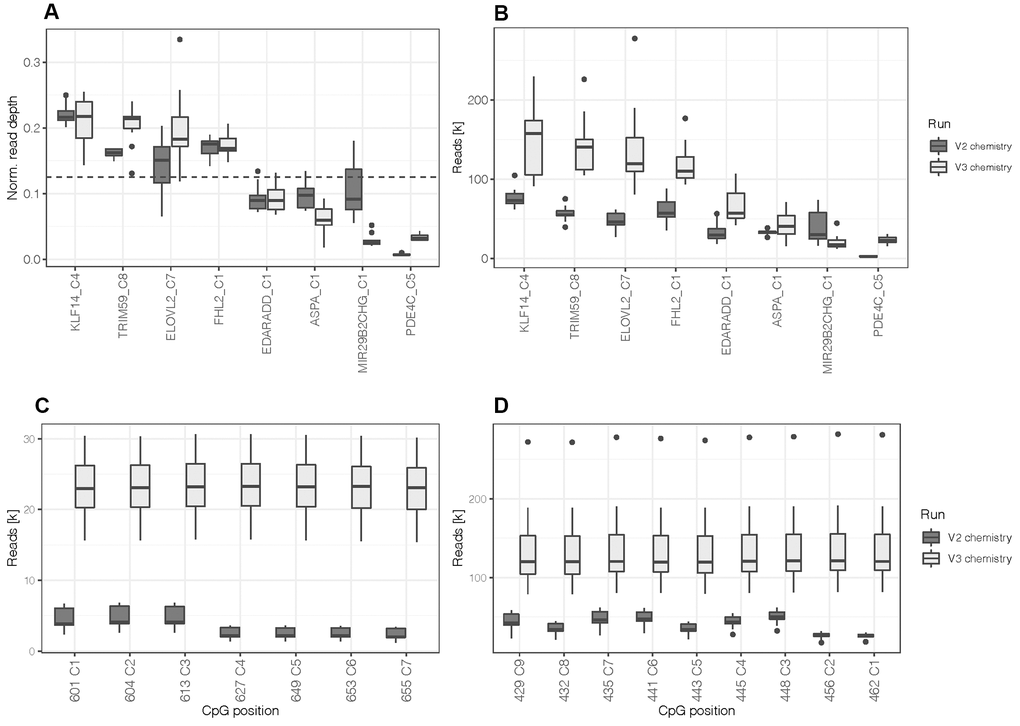
Figure 1.(A) Normalized read depth was calculated by selecting one CpG site per marker to assess for read distribution between amplicons. The dashed line indicates the expected value per marker (0.125) in case of a perfectly balanced distribution. (B) Read depth at one CpG site per marker. (C) Read depth at all CpGs located in the target sequence of PDE4C and (D) ELOVL2. All boxplots compare DNA methylation standards processed with the first assay design using the MiSeq reagent kit v2 (N = 10) and the re-optimized assay (design 2) using the MiSeq reagent kit v3 (N = 12).