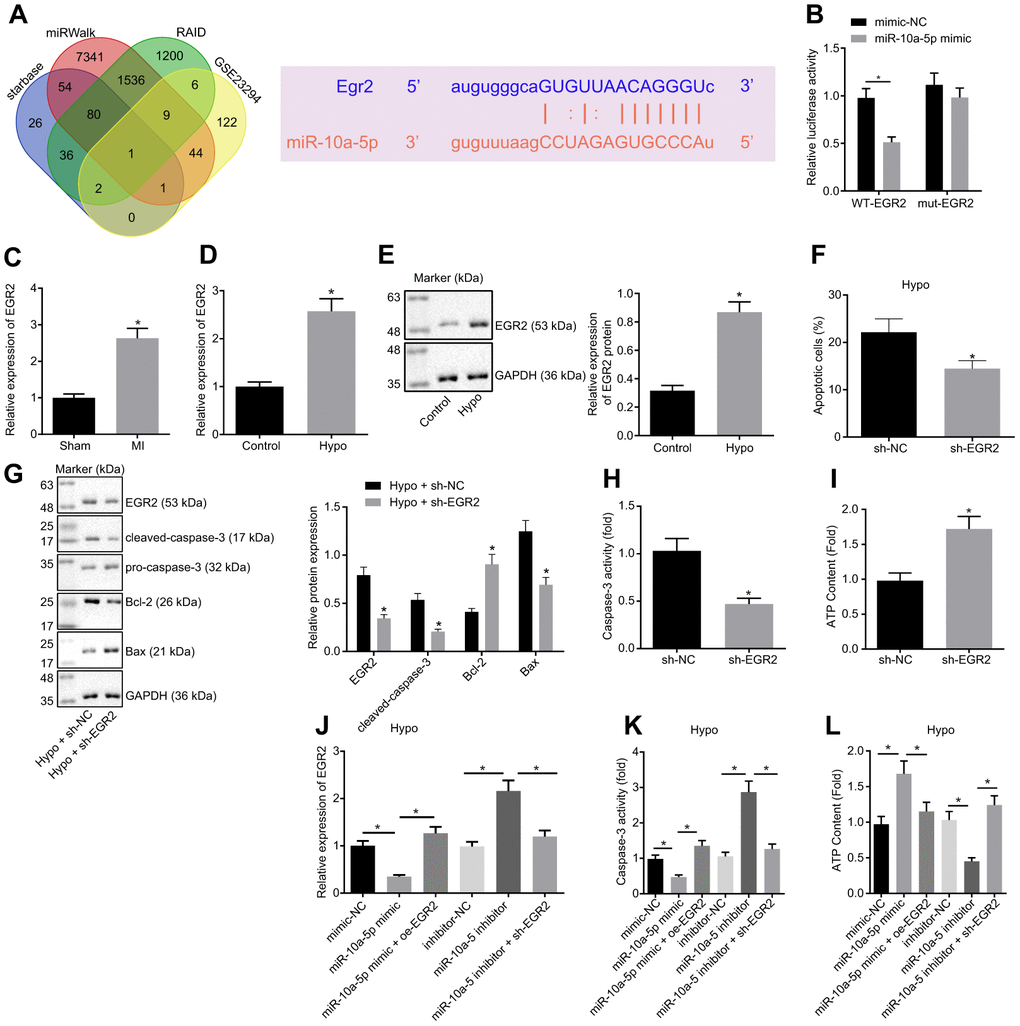
Figure 3.Overexpression of miR-10a-5p decreased cardiomyocyte apoptosis through inhibiting EGR2. (A) The target genes of miR-10a-5p predicted using Starbase, miRWalk, and RAID databases and the up-regulated genes in MI-related dataset GSE23294 and the potential binding sites of miR-10a-5p on EGR2. (B) The luciferase activity measured by dual-luciferase reporter gene assay. (C) Expression of EGR2 in myocardial tissues normalized to GAPDH determined by RT-qPCR (n = 10). (D) The expression pattern of EGR2 in hypoxic cardiomyocytes normalized to GAPDH determined by RT-qPCR. (E) The expression pattern of EGR2 in cardiomyocytes normalized to GAPDH determined by Western blot analysis. (F), Apoptosis of cardiomyocytes after EGR2 silencing determined by flow cytometry. (G) The expression patterns of EGR2, cleaved-caspase-3, Bax and Bcl-2 in cardiomyocytes after EGR2 silencing normalized to GAPDH determined by Western blot analysis. (H) The caspase-3 activity in hypoxic cardiomyocytes after EGR2 silencing. (I) The ATP content in hypoxic cardiomyocytes after EGR2 silencing. (J) The expression pattern of EGR2 in the hypoxic cardiomyocytes after alteration of EGR2 and/or miR-10a-5p normalized to GAPDH determined by RT-qPCR. (K) The caspase-3 activity in hypoxic cardiomyocytes after alteration of EGR2 and/or miR-10a-5p determined by RT-qPCR. (L) The ATP content in hypoxic cardiomyocytes after alteration of EGR2 and/or miR-10a-5p. * p < 0.05. The above data were all measurement data, and expressed as mean ± standard deviation. The unpaired t test was adopted for comparison between two groups. One-way ANOVA was adopted for comparison among multiple groups with Tukey’s post hoc test. All data was generated from 3 independent experiments respectively.