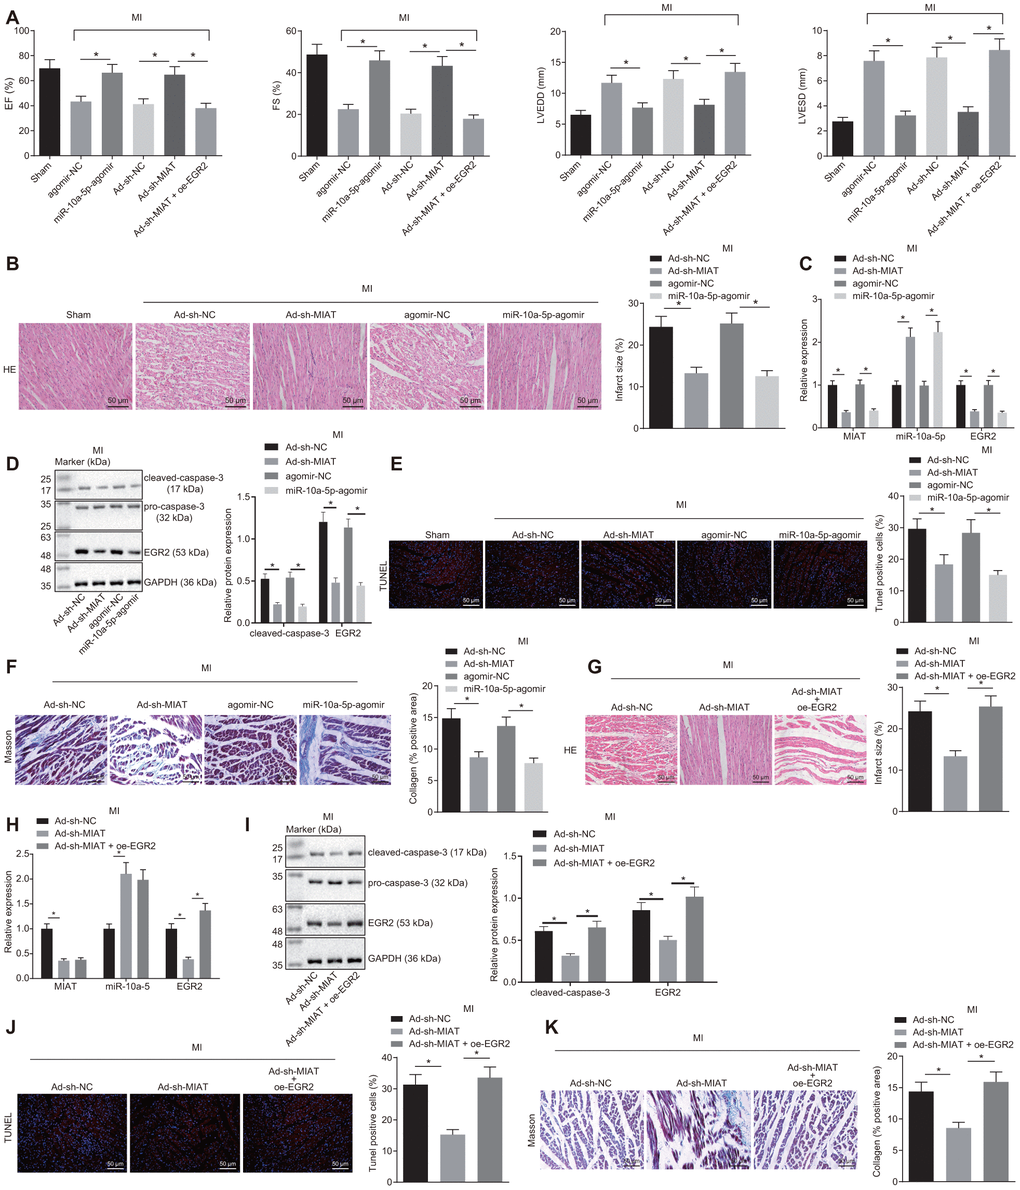
Figure 5.MIAT silencing improves cardiomyocyte function in MI mice by inhibiting EGR2 through miR-10a-5p upregulation. (A) EF, FS, LVEDD, and LVESD values in mice detected by small animal echocardiogram after MI modeling with alteration of MIAT, miR-10a-5p or EGR2. (B) Myocardial infarct size identified by HE staining after alteration of MIAT and miR-10a-5p (scale bar = 50 μm). (C) The expression patterns of MIAT, miR-10a-5p and EGR2 in the cardiac tissues of MI mice after alteration of MIAT and miR-10a-5p determined by RT-qPCR. (D) The expression patterns of cleaved caspase-3 and EGR2 normalized to GAPDH in the myocardial tissues of MI mice after alteration of MIAT and miR-10a-5p determined by Western blot analysis. (E) The apoptosis in myocardial tissues after alteration of MIAT and miR-10a-5p showed by TUNEL staining (scale bar = 50 μm). The red signal represented TUNEL-positive cells. (F) The collagen deposition in the myocardial tissues of MI mice after alteration of MIAT and miR-10a-5p showed by Masson staining (scale bar = 50 μm). The blue color represented collagen. (G) The myocardial infarct size in mice after alteration of MIAT and EGR2 showed by HE staining (scale bar = 50 μm). (H) The expression patterns of MIAT, miR-10a-5p and EGR2 in cardiac tissues of MI mice after alteration of MIAT and EGR2 determined by RT-qPCR. (I) Western blot showing the expression patterns of cleaved caspase-3, pro-caspase-3 and EGR2 in mouse myocardial tissues after alteration of MIAT and EGR2. The expression level is normalized to GAPDH. (J) The apoptosis in myocardial tissues of MI mice after alteration of MIAT and EGR2 determined by TUNEL staining (scale bar = 50 μm). The red signal represented TUNEL-positive cells. (K) The collagen deposition in the myocardial tissues of MI mice after alteration of MIAT and EGR2 showed by Masson staining (scale bar = 50 μm), and blue referred to collagen. The animals were selected blindly, and all values were measured on the same animal for 6 consecutive cardiac cycles. * p < 0.05. The above data were all measurement data, and expressed as mean ± standard deviation. The data of multiple groups were compared by one-way ANOVA and Tukey’s post hoc test. n = 10.