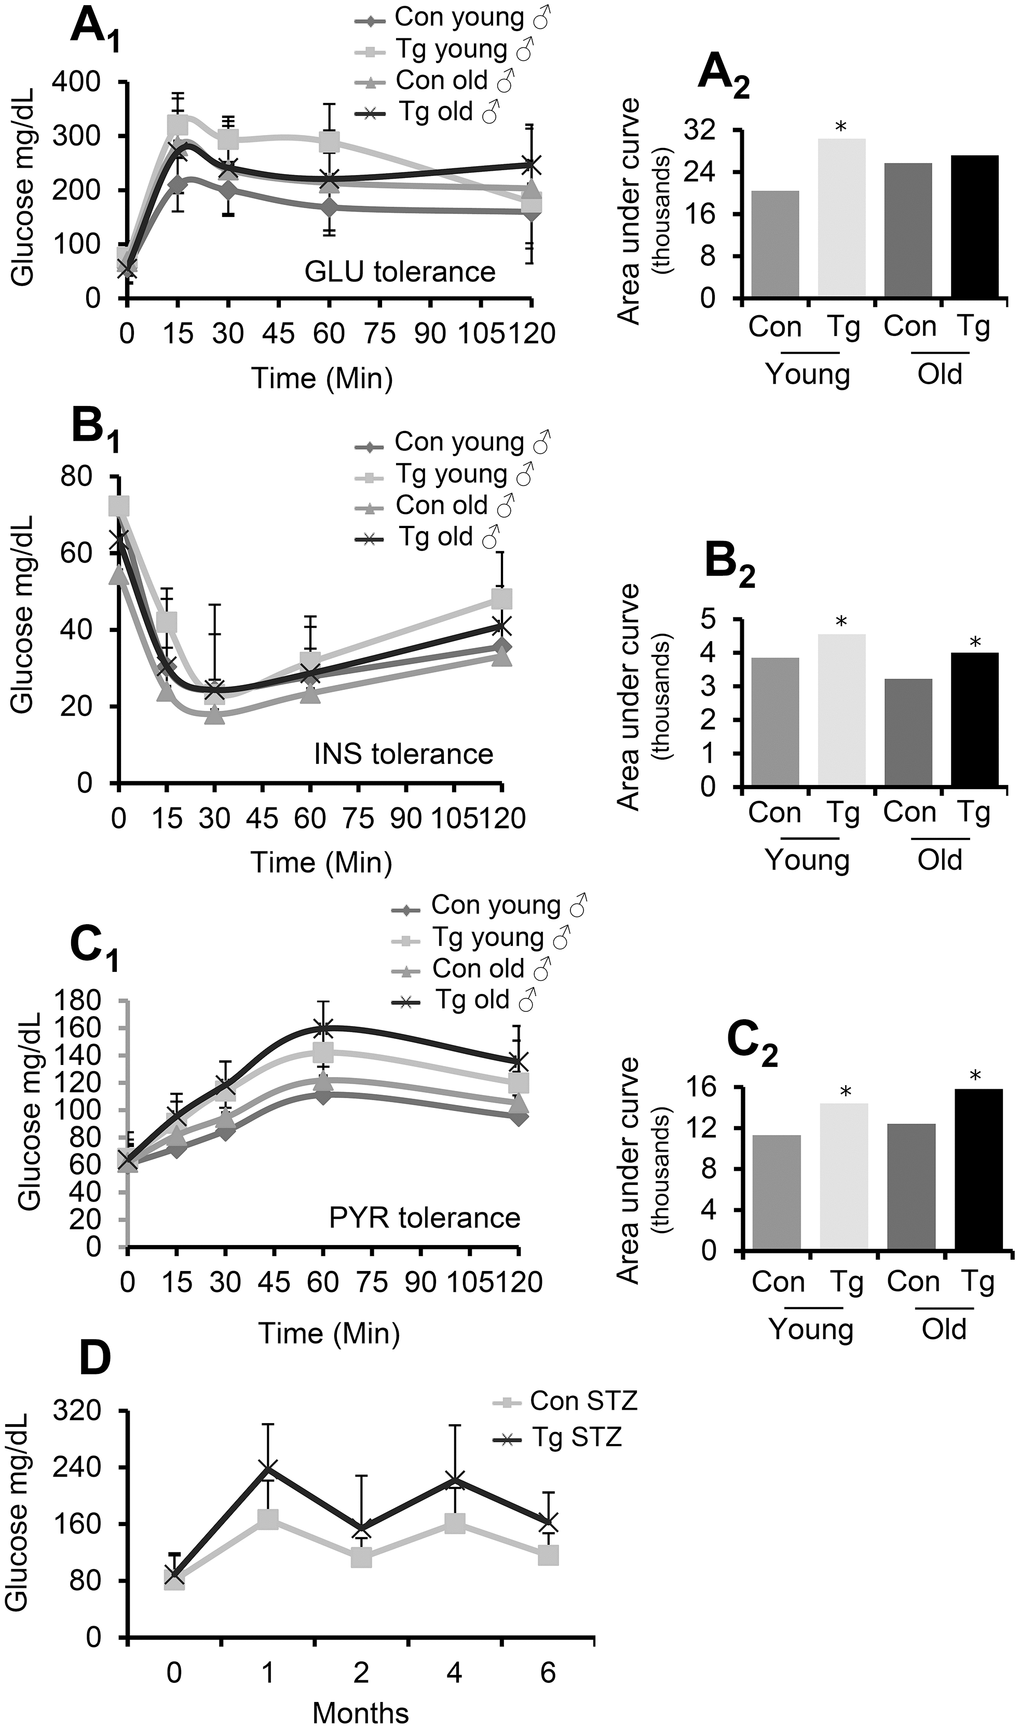
Figure 4.Pancreas-targeted CLU OE induces GLU, INS and PYR decreased tolerance. (A) GLU tolerance curve (A1) and area under the curve (A2, calculated from the sum of the areas of the different trapeziums formed) in shown animal groups; GLU levels were measured before and after (15, 30, 60 and 120 min) GLU injection. (B) INS tolerance test. Shown is GLU tolerance curve (B1) and area under the curve [B2, calculated as in (A2)] in indicated animal groups; GLU levels were measured before and after (15, 30, 60 and 120 min) INS injection. (C) PYR tolerance test. Shown is GLU tolerance curve (C1) and area under the curve [C2, calculated as in (A2)] in indicated animal groups; GLU levels were measured before and after (15, 30, 60 and 120 min) PYR injection. (D) GLU levels following STZ administration in control (Con STZ) and Tg (Tg STZ) mice. GLU levels were measured during the whole duration of the experiment (6 months). Con; young or old littermate non-Tg male animals; Tg; young or old pancreas-targeted CLU OE heterozygous male mice. Error bars are shown in curves (A1–C1). In (A–C) n=9-11 per mouse genotype; in (D) n=5 per mouse genotype. Error bars, ± SD; *P<0.05; **P<0.01.