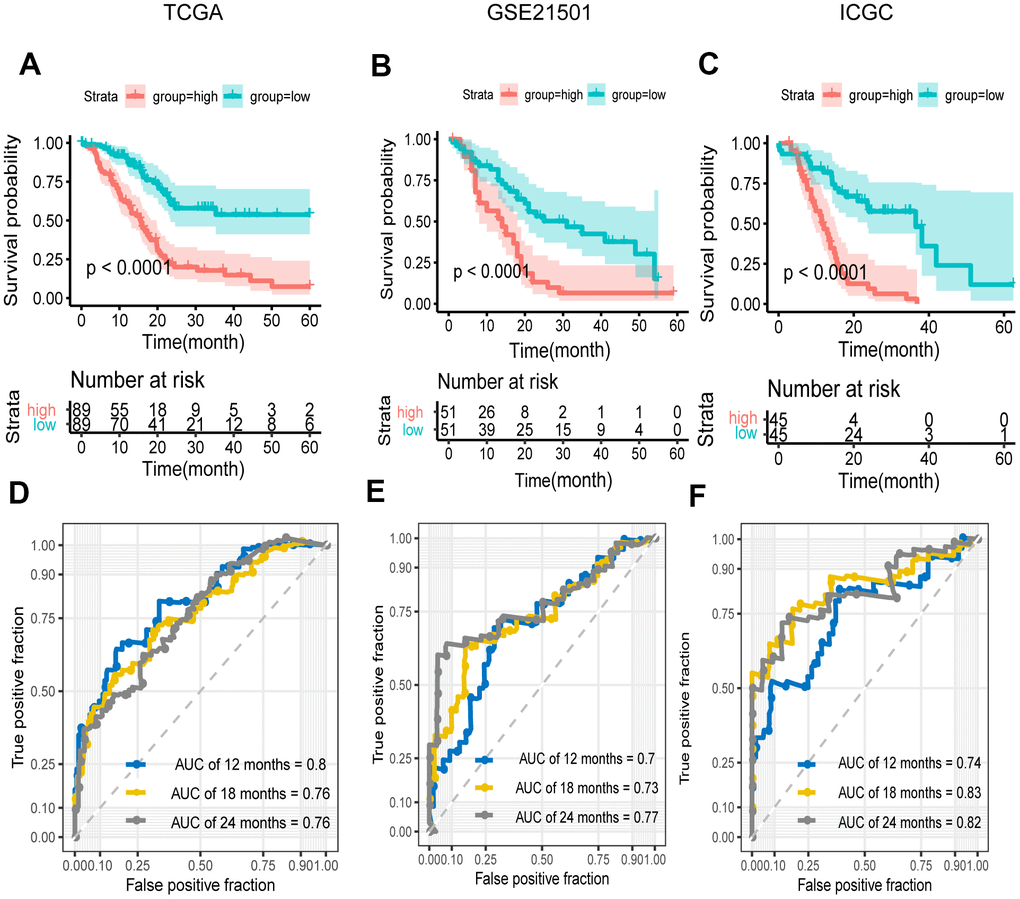
Figure 4.Survival and ROC analysis in training and validation datasets. (A–C) Kaplan–Meier overall survival curves for patients in high- and low-risk groups of the TCGA (A), GEO (B), and ICGC (C) datasets. Hazard ratios (HRs) and 95% CIs are for risk group. P values were calculated with the log-rank test. (D–F) Time-dependent ROC curves at 12, 18, 24 months for patients in the TCGA (D), GSE21501 (E), and ICGC (F) datasets to evaluate the prediction efficiency of the prognostic signature.