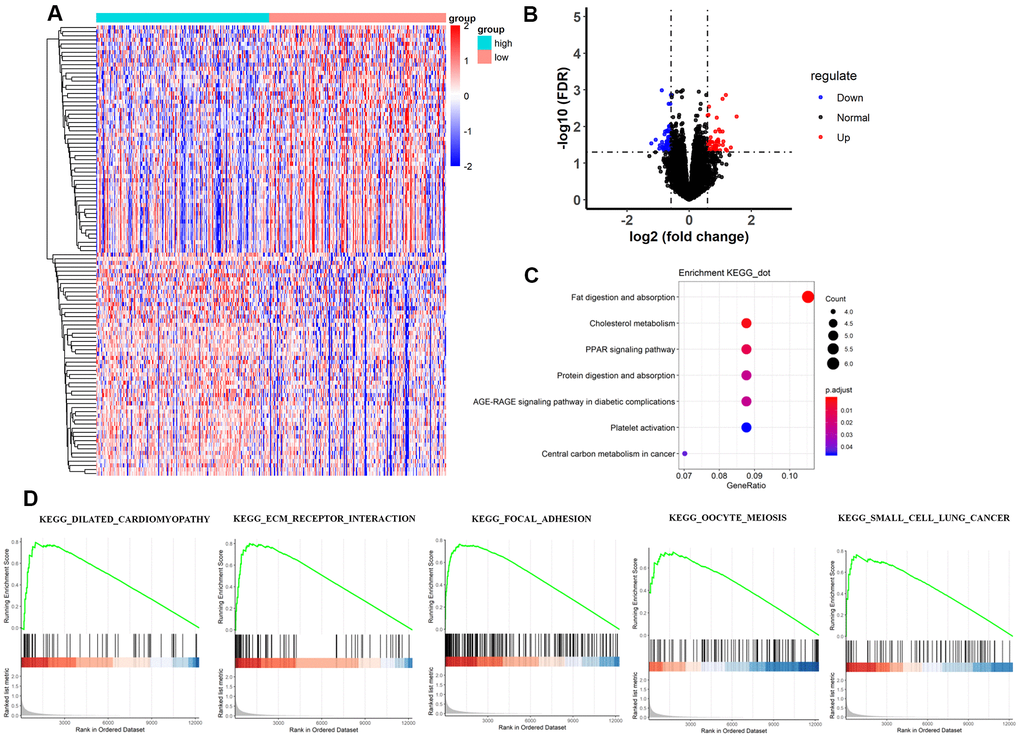
Figure 3.Comparisons of gene expression profiles in low-TMB and high-TMB groups and enrichment pathway analysis. (A) Top 109 DEGs are shown in the heatmap plot. Vertical and horizontal axes represent genes and HCC samples respectively, as ranked by TMB value. Genes with higher and lower levels are shown in red and blue, respectively. Color bars at the top of the heat map represent sample types, with pink and blue indicating low- and high-TMB samples, respectively. (B) Volcano plot of all DEGs were drawn with |log(FC) > 1| and FDR < 0.05. Each symbol represents a gene, and red, blue and black colors indicate upregulated, downregulated and normal genes, respectively. (C) KEGG pathway analysis revealed that these genes were involved in immune-related pathways, such as cholesterol metabolism; (D) Moreover, GSEA analysis shown that the top TMB-related crosstalk, including dilated cardiomyopathy, ECM-receptor interaction, focal adhesion, oocyte meiosis, and small cell lung cancer with FDR < 0.3. The vertical axis represents enrichment score. The enrichment score increased with the number of enriched genes and vice versa. DEGs, differentially expressed genes; TMB, tumor mutation burden; KEGG, Kyoto Encyclopedia of Genes and Genomes; ECM, extracellular matrix; HCC, hepatocellular carcinoma; GSEA, gene set enrichment analysis.