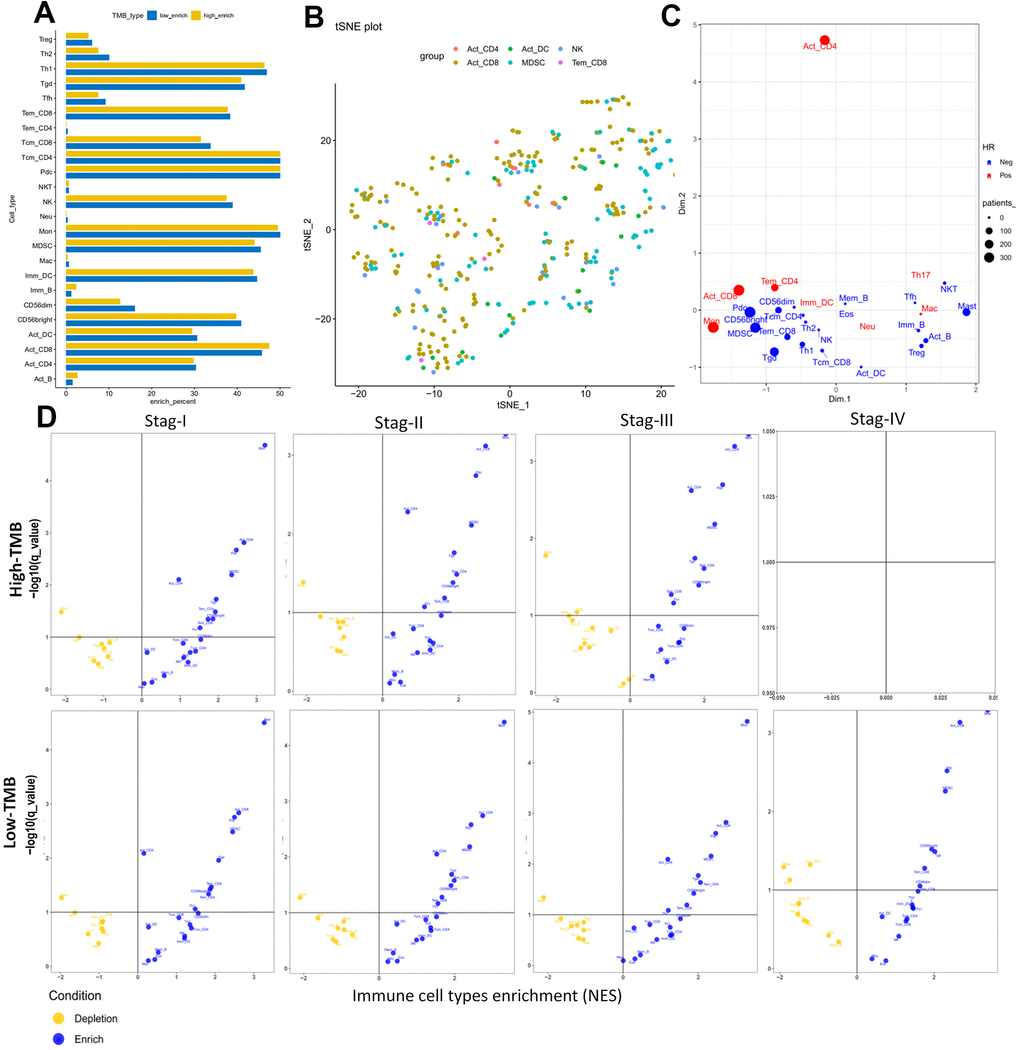
Figure 9.Cellular characterization of immune infiltrates based on GSEA database. (A) Correspondence analysis of immune subpopulations in HCC. Horizontal and vertical axes represent enrich percent and immune subpopulations, respectively. Yellow and blue bar are samples with higher and lower immune cell fractions, respectively. (B) t-SNE showing individual patients and selected cell types based on two dimensional coordinates. Different colors are different immune subpopulations respectively. (C) Visualization of the immune infiltrates for all patients using two dimensional coordinates from multidimensional scaling (MDS). (D) Volcano plots for the enrichment (blue) and depletion (yellow) of immune cell types across cancers for tumor stage I to IV calculated based on the NES score in high-TMB (up panel) and low-TMB (down panel) from the GSEA. Horizontal and vertical axes represent Immune cell types enrichment (NES) and −log10(q−value), respectively. There were not any pots in stage IV for high-TMB, because there were not enough samples for analysis.