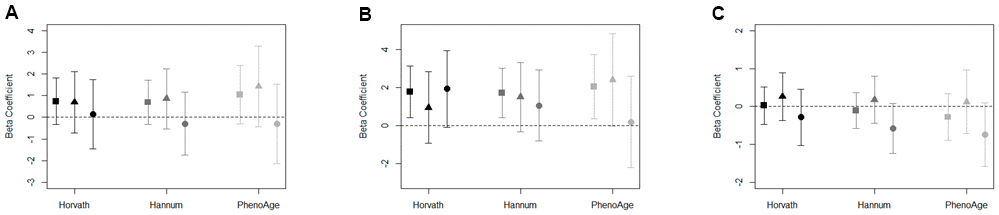
Figure 1.(A–C) Association between (A) neighborhood poverty, (B) neighborhood PC7, (C) neighborhood social cohesion, and DNAm age acceleration measures for total sample (square), women (triangle), and men (circle). Models adjusted for race/ethnicity, education level, employment, smoking status, alcohol intake, and years residing in current neighborhood. Black symbols represent associations with Horvath age acceleration, dark gray represent Hannum age acceleration, and light gray represent PhenoAge acceleration.