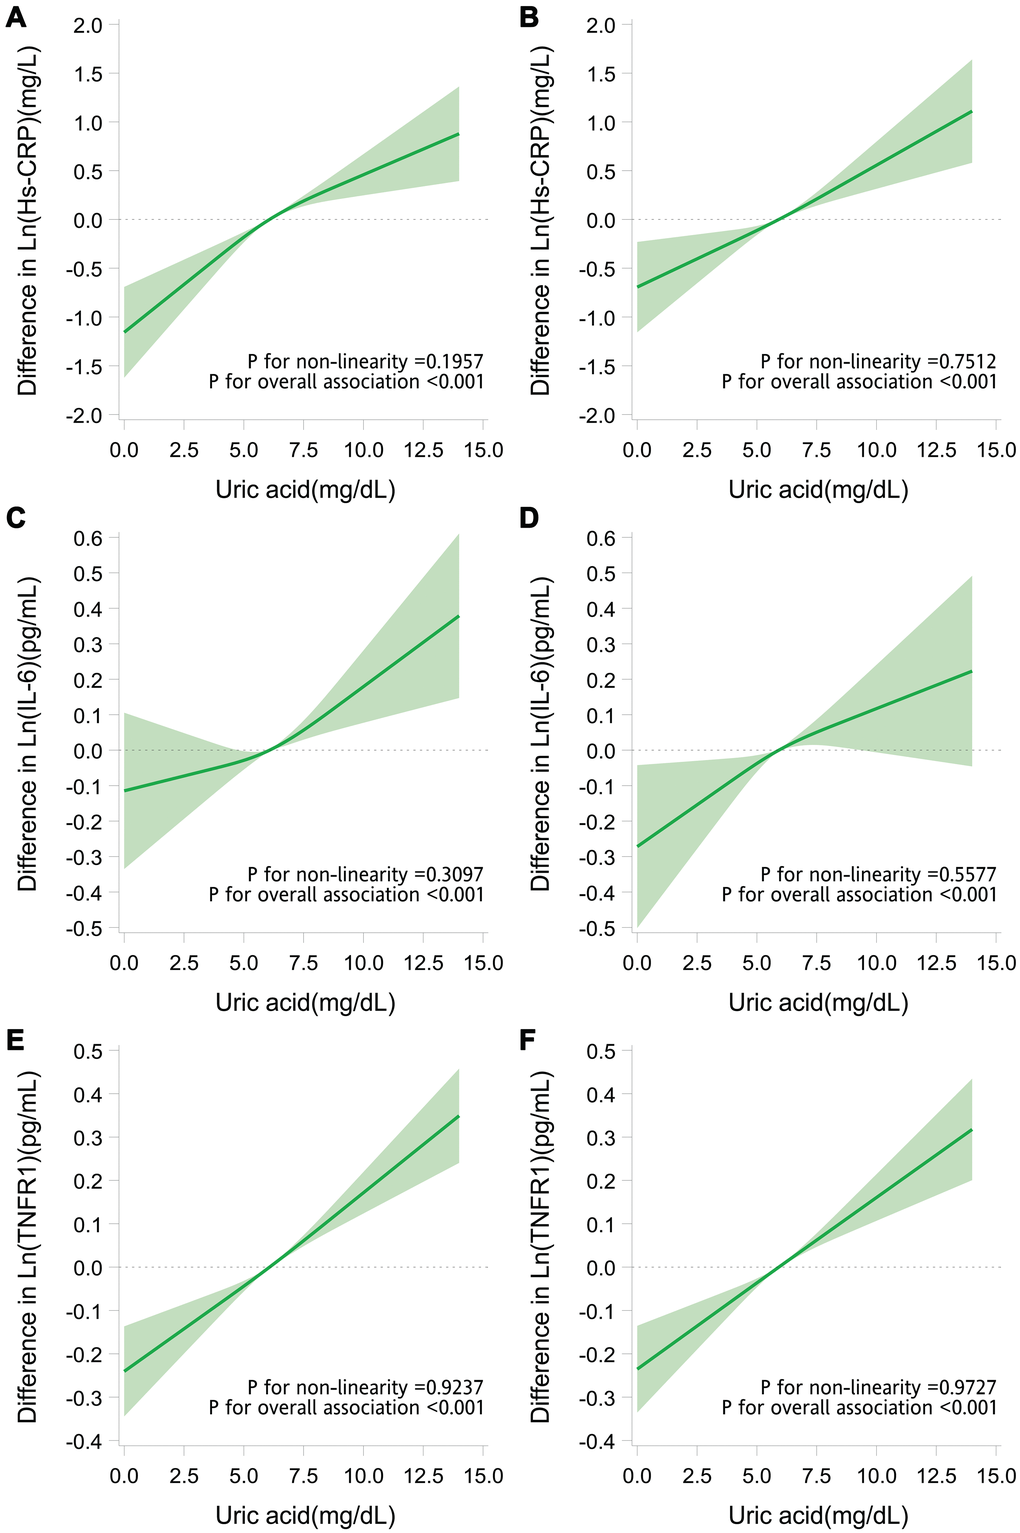
Figure 4.Adjusted dose-response relationship of serum uric acid with inflammatory markers. Difference (solid line) in levels of hs-CRP (A, B), IL-6 (C, D), and TNFR1 (E, F) associated with the uric acid levels and the mean uric acid levels (6.1 mg/dL in older adults with low grip strength and 5.9 mg/dL in those with high grip strength) in older adults with low grip strength (A, C, E) and in those with high grip strength (B, D, F). Data were obtained from restricted cubic spline regression models with the natural log-transformed inflammatory marker levels (continuous variables) as the dependent variables and uric acid level (continuous variable with splines having 3 knots placed at the 5th, 50th, and 95th percentiles) and potential confounders (age, sex, marital status, behavioral characteristics, body mass index, chronic diseases, and use of uric acid–lowering drugs) as the independent variables. The band denotes 95% confidence intervals.