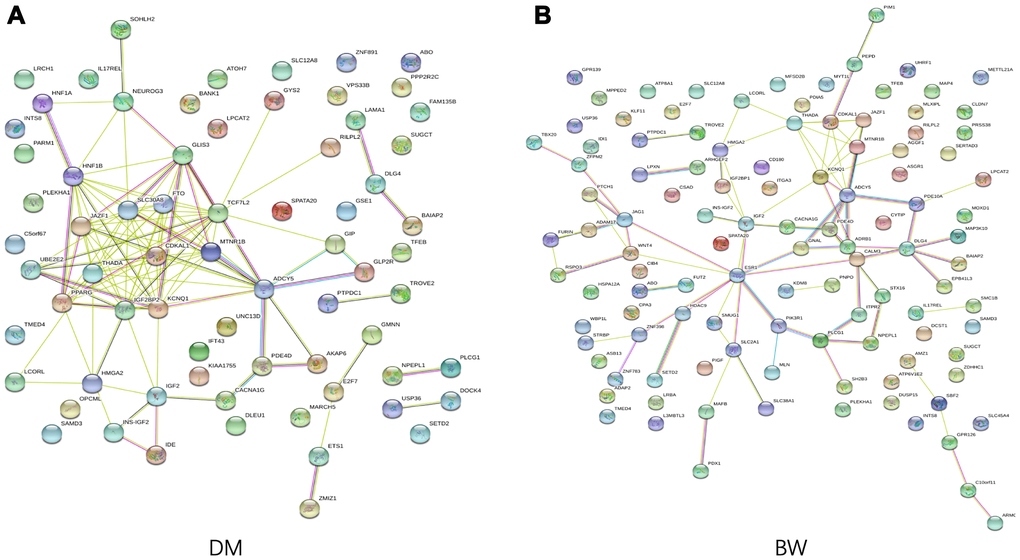
Figure 3.Functional protein association network analysis. Connections are based on evidence with a STRING 11.0 summary score above 0.4. Each network nodes represent a gene; edges between nodes indicate protein-protein interactions between protein products of the corresponding genes in (A) T2D and (B) BW, edge colors indicate the types of interaction.