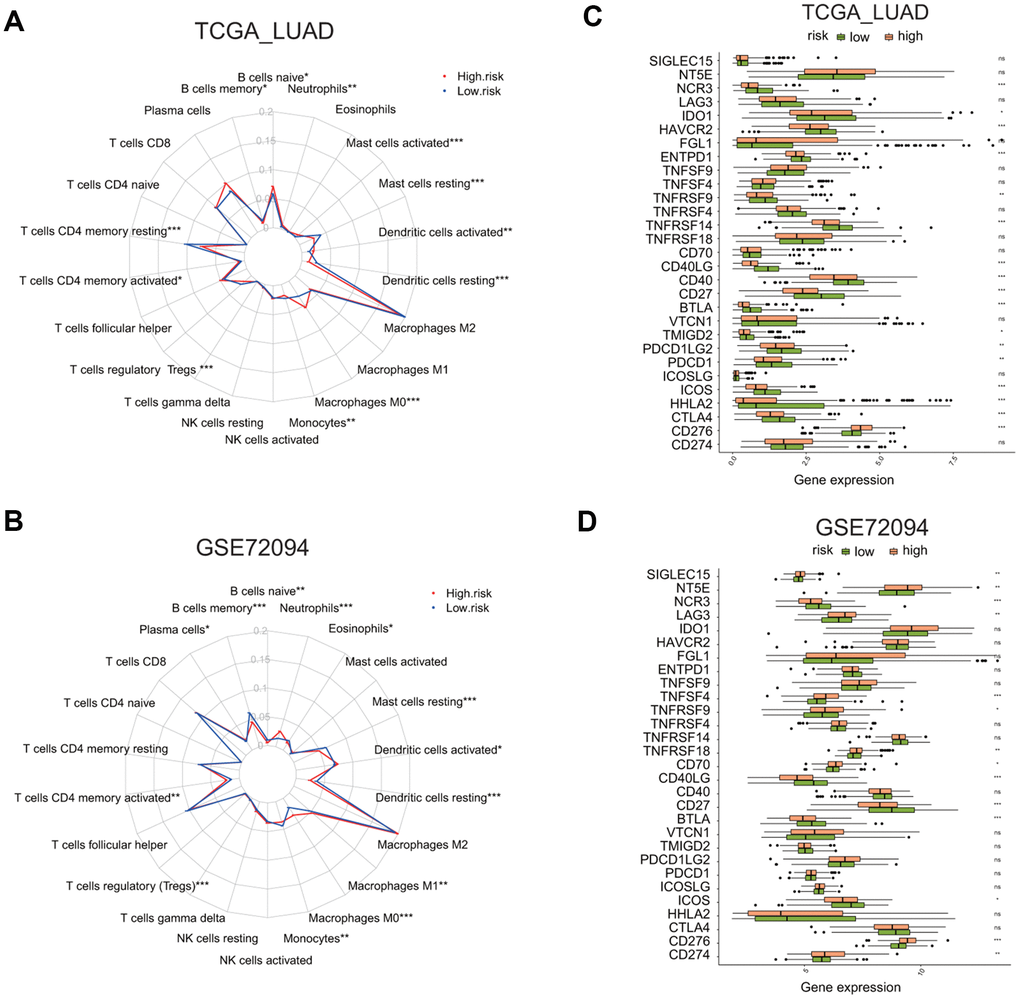
Figure 9.Comparison of immune cell infiltration and immune checkpoint gene expression between the high and low risk groups in two LUAD cohorts. (A, B) Radar plots show the distribution of the enrichment levels of 22 immune cells in the high (red line) or low (blue line) risk group in the LUAD cohorts: TCGA (A) and GSE72094 (B). Statistically significant difference in the enrichment level of immune cells between the high and low risk groups is indicated by the asterisks. *P < 0.05, **P < 0.01, ***P < 0.001. (C, D) Bar plots show the comparison of the expression of 29 immune checkpoint genes between the low and high risk groups in two LUAD cohorts: TCGA (C) and GSE72094 (D), by *P < 0.05, **P < 0.01, ***P < 0.001.