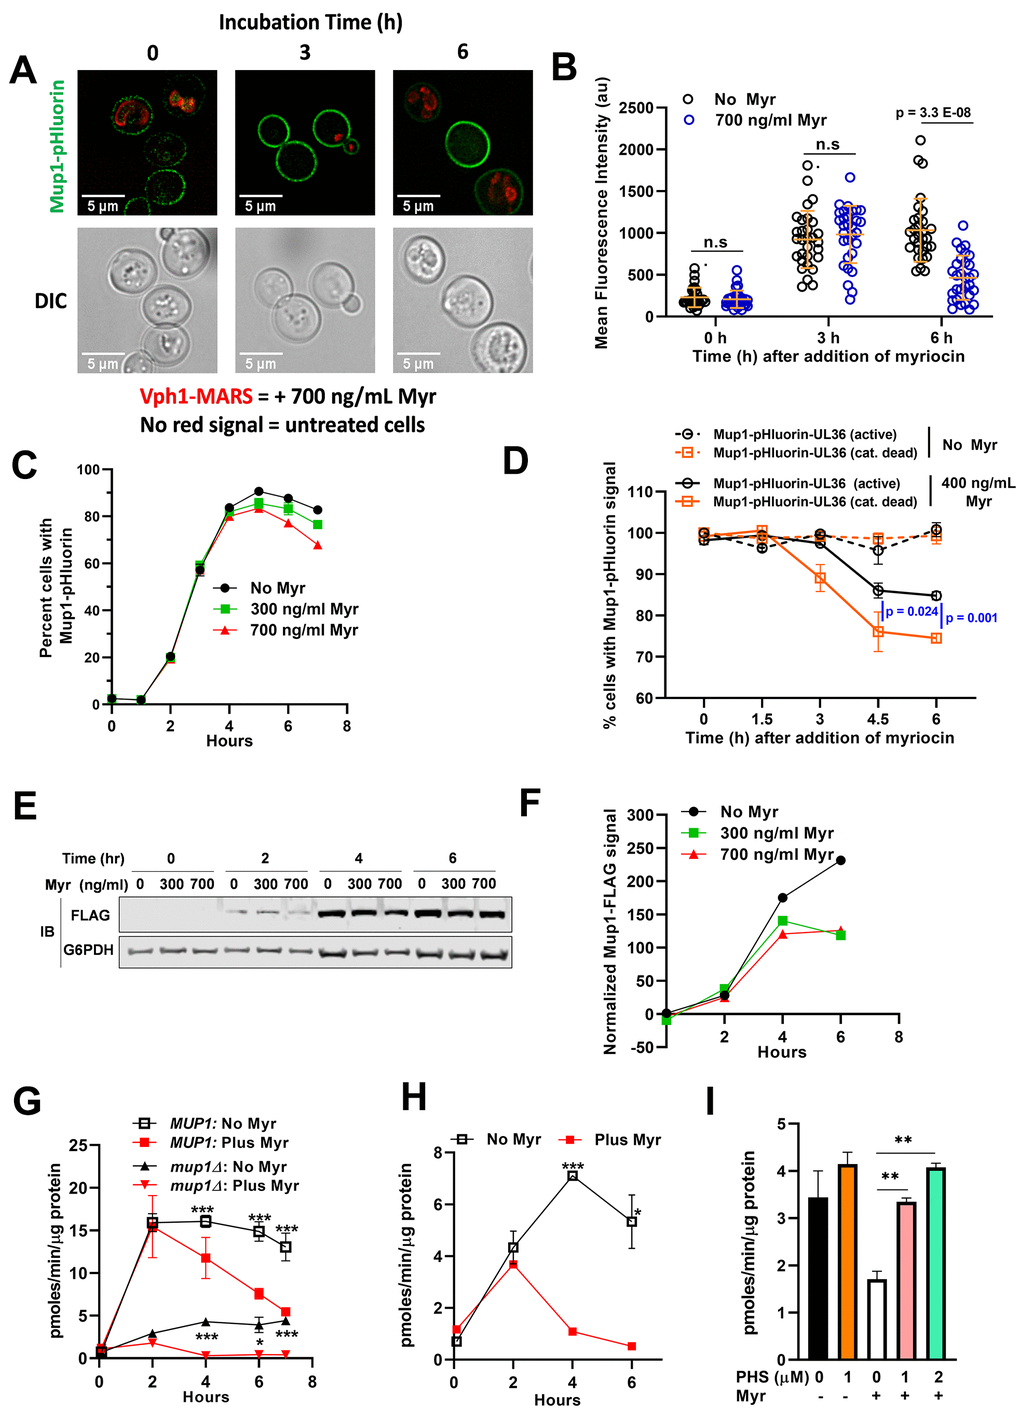
Figure 5.Myr treatment reduces Mup1 activity in the PM. (A) Cells expressing Mup1-pHluorin (NHY413) or Mup1-pHluorin and Vph1-MARS (NHY414) were grown for 20 h to stationary phase and then inoculated into methionine-deficient media in the presence (NHY414) or absence (NHY413) of 1.743 umol/L (700 ng/ml) Myr. Cells were mixed prior to visualization by fluorescence microscopy so that untreated and Myr-treated cells can be visualized side-by-side. (B) Quantification of Mup1-pHluorin microscopy signal shown in (A). Mean signal intensity of Mup1-pHluorin at the plasma membrane was measured for individual cells (n≥30) using ImageJ-Fiji. (C) Relative fluorescence intensity of Mup1-pHluorin in JMY1811 cells was determined over time in triplicate cultures by flow cytometry. Cells grown to stationary phase in SC medium lacking Met were washed, diluted into fresh medium, and 10,000 cells were analyzed at each sampling time point in cultures containing or lacking Myr. (D) Cells expressing Mup1-pHluorin-UL36 (NHY447) or Mup1-pHluorin-UL36 catalytic dead Vph1-MARS (NHY431) were grown to mid-log phase, mixed, and subcultured into methionine-deficient media with or without 0.996 μmol/L (400 ng/ml) Myr. Fluorescent cells were quantified in 5000 sampled cells over time using a flow cytometer. (E) Immunoblotting analysis of Mup1-FLAG in cells grown in SDC medium. G6PDH immunoblots (bottom panel) were used as a loading control for the blots. (F) Quantification of the anti-FLAG immunoblot signal shown in (E) using the relative fluorescence of G6PDH as a loading normalization. (G) The uptake rate of 12 μmol/L 3H-Met in JMY1811 and JMY305 (mup1∆) cells was measured on cells grown in the same way as described in panel (C). Statistical significance: MUP1:No Myr vs Plus Myr (AUC, 95% CI: 88.03-97.24 vs 56.89-80.86) and mup1:No Myr vs Plus Myr (AUC, 95% CI: 21.02-25.09 vs 5.593-6.345). (H) The uptake rate of 12 μmol/L 3H-Met was measured on JMY1811 cells grown in the same way as described in panel (E). Statistical significance: No Myr vs Plus Myr (AUC, 95% CI: 26.02-31.38 vs 10.67-11.38). (I) Supplementing culture medium with phytosphingosine (PHS) restores Met uptake in Myr-treated BY4741 cells. 3H-Met uptake was measured with a substrate concentration of 12 μmol/L in cells grown for 4 h in SDC medium with or without PHS and with or without Myr treatment.