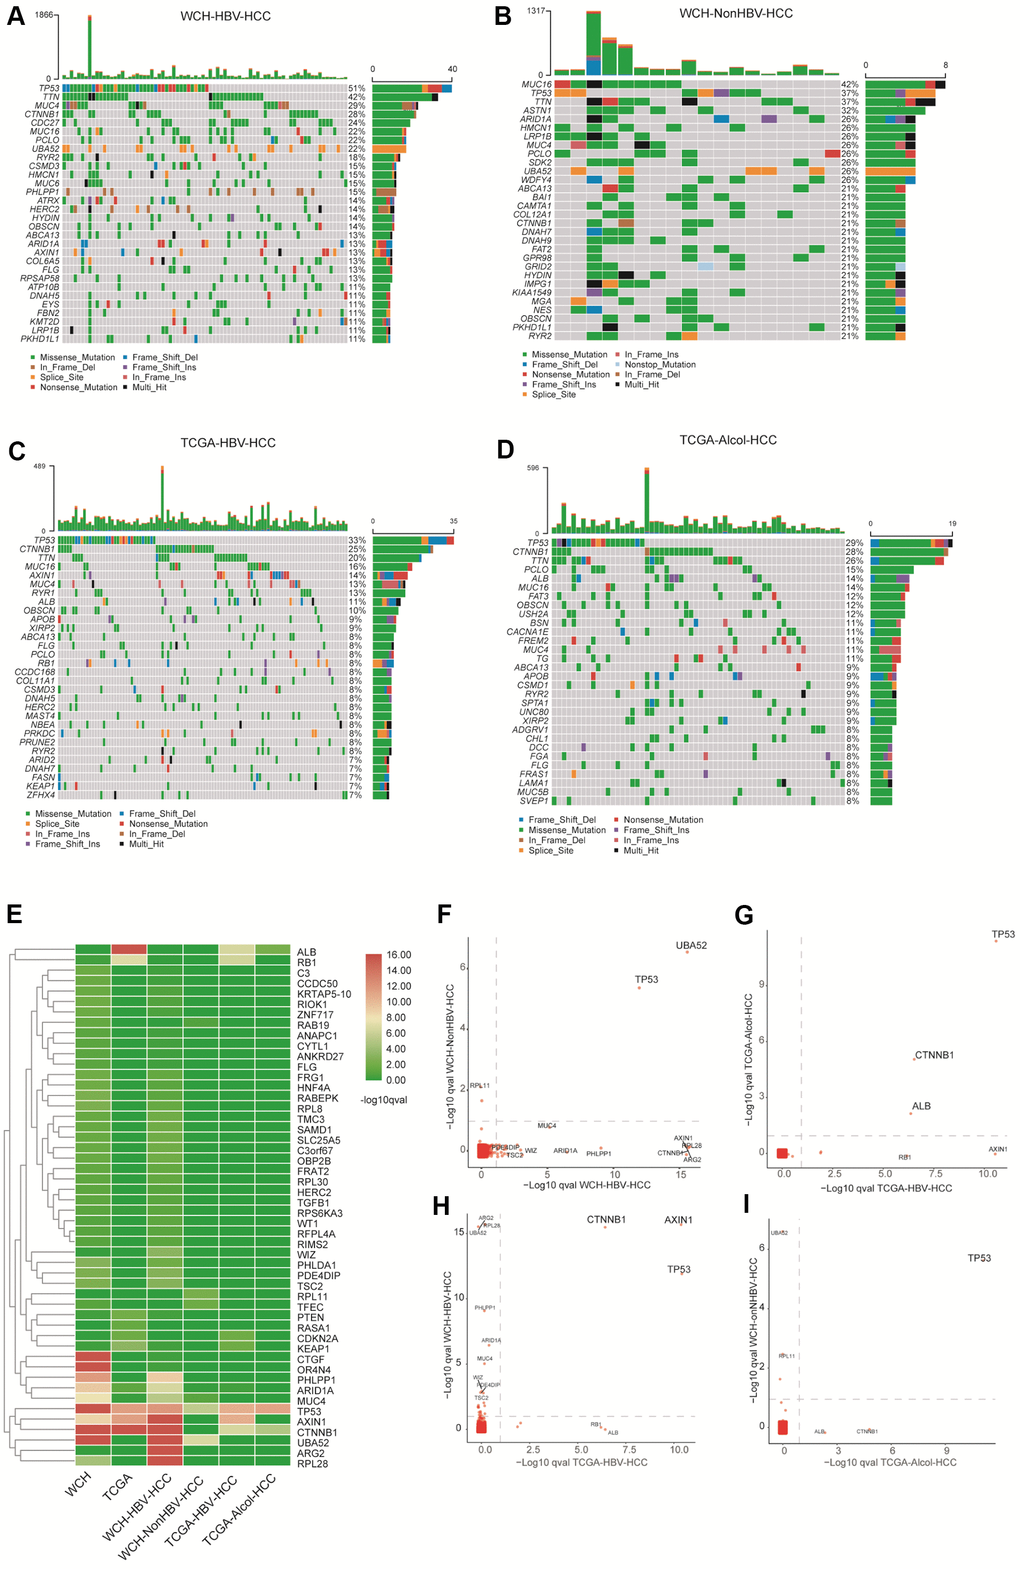
Figure 3.Gene mutations in the four groups. (A) The top 30 most commonly mutant genes in the WCH-HBV-HCC group. (B) The top 30 most commonly mutant genes in the WCH-NonHBV-HCC group. (C) TCGA-HBV- The top 30 most commonly mutant genes in the HCC group. (D) Top 30 most commonly mutant genes in the TCGA-Alcol-HCC group. (E) Hierarchical cluster analysis shows the q value of gene mutations in each group. The screening criteria of genes shown in Figure 2E is: q value <0.1 in at least one group. (F) Gene mutations in the WCH-HBV-HCC group and WCH-NonHBV-HCC group. (G) Gene mutations in the TCGA-Alcol-HCC group and TCGA-HBV-HCC group. (H) Gene mutations in the WCH-HBV-HCC group and TCGA-HBV-HCC group. (I) Gene mutations in the WCH-NonHBV-HCC group and TCGA-Alcol-HCC group. The q values for gene mutations are compared among different groups. Gene mutations with q values <0.1 were deemed as significant. The position of the dotted line is the cutoffs of the q value.