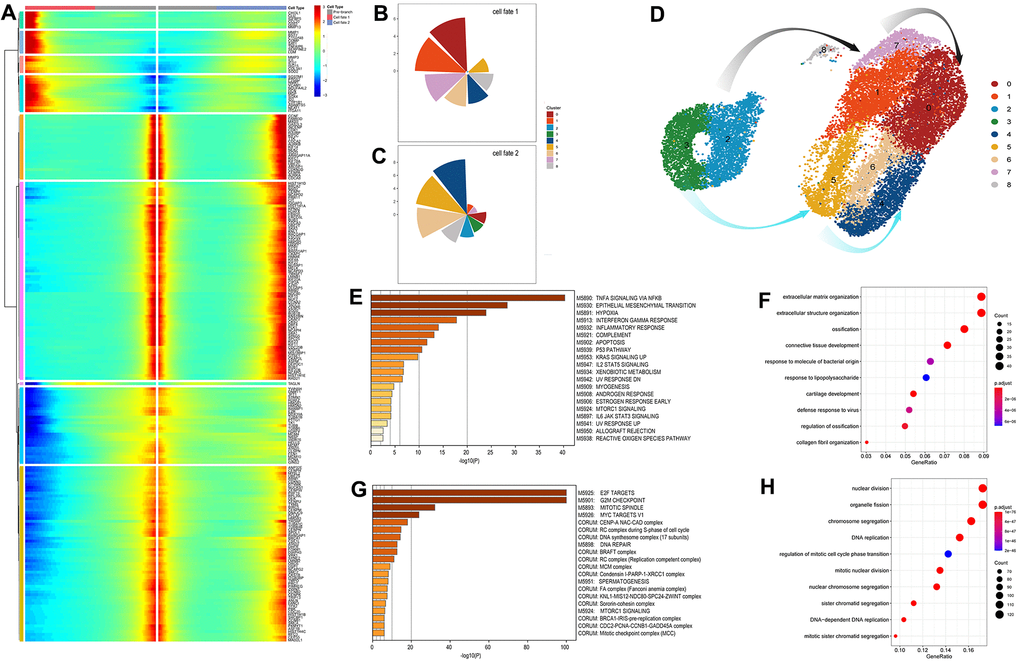
Figure 4.Identification and analysis of genes involve in the connected point in the pseudo-time trajectory (A) The expression patterns of the genes associated with cell fate at point 1. Cell fates depend on the up- or down-regulation of these genes. (B, C) The pie chart of the proportions of the distinct cell clusters in cell fate 1 and 2. (D) The exhibition of cell transformation along two defined pathways. The grey arrows indicate the response-to-inflammation path and the azure arrows indicate the atypical response-to-inflammation path. (E, F) Significant signaling pathways and biological processes identified by Gene set enrichment analysis (GSEA) and gene ontology (GO) analysis conducted on fate 1 (the response-to-inflammation path) associated genes. (G, H) Significant signaling pathways and biological processes identified by Gene set enrichment analysis (GSEA) and gene ontology (GO) analysis conducted on fate 2 (the atypical response-to-inflammation path) associated genes.