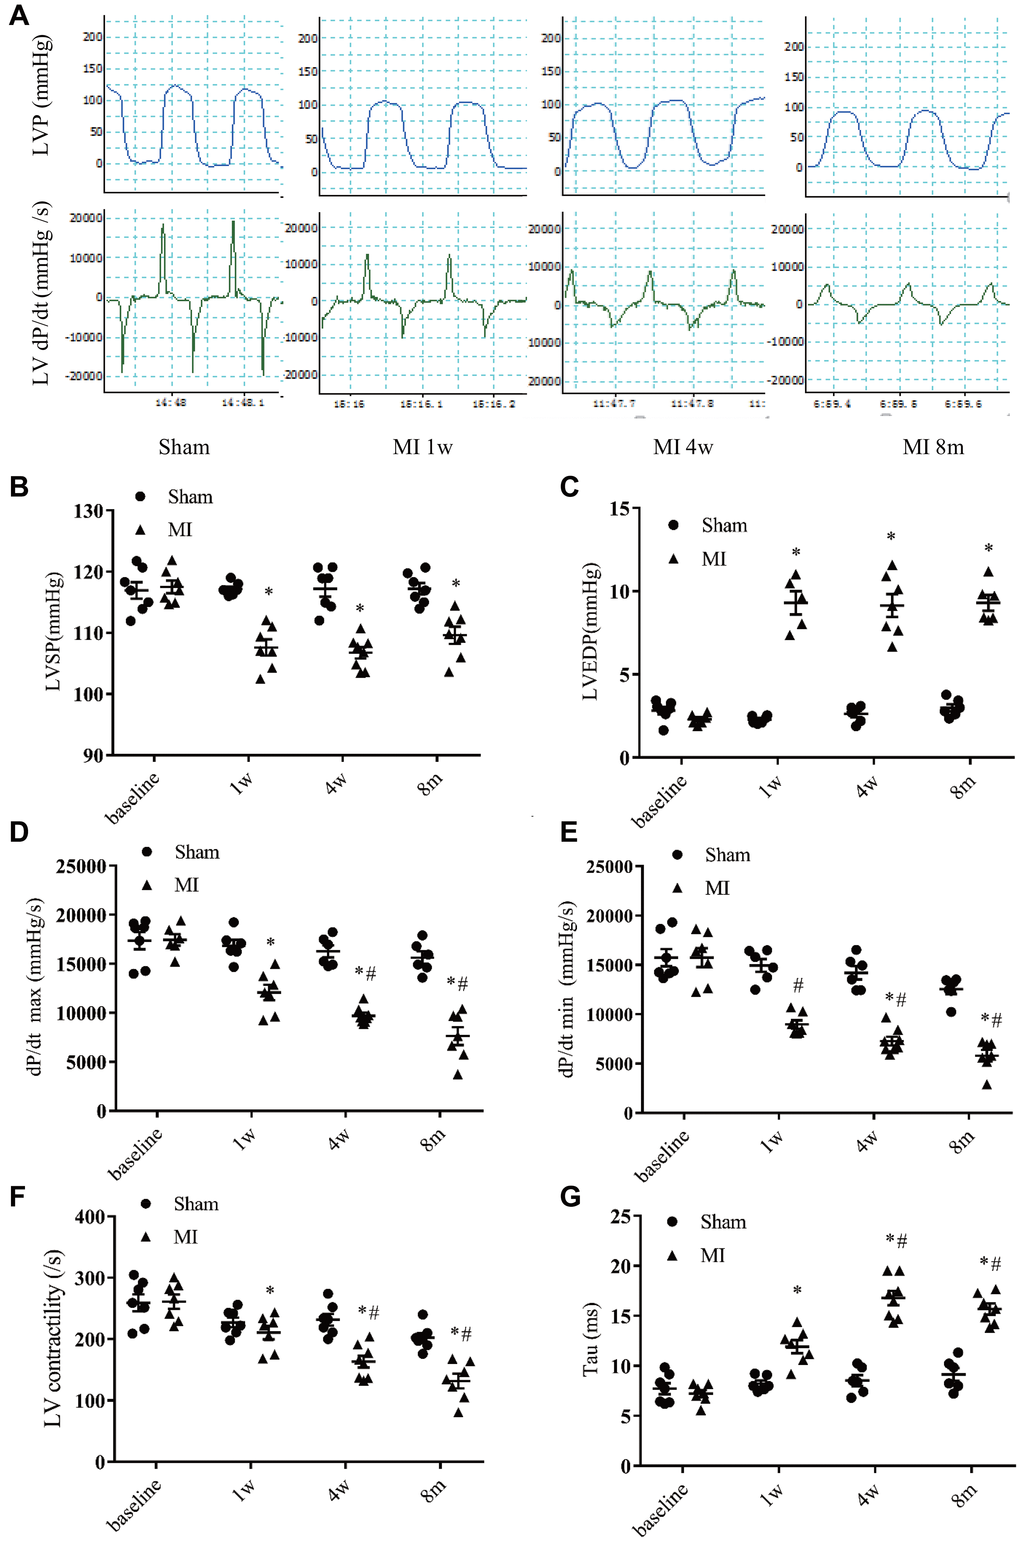
Figure 5.Hemodynamics assessment of left ventricular function. (A) Representative recordings of left ventricular (LV) pressure and pressure change rate (dp/dt). (B) LV systolic pressure. (C) LV end-diastolic pressure. (D) Maximum increasing rate of LV pressure (dp/dt max). (E) Maximum descending rate of the LV pressure (dp/dt min). (F) LV contractility index (dp/dt max divided by the pressure at the time of dp/dt max). (G) Exponential time constant of relaxation (Tau). *P < 0.05 compared with the sham group. #P < 0.05 compared with the prior time point in the MI group. n = 6–10 at various time point.