Submit an Article
Navigate
Home
Editorial Board
Editorial Policies
Current Volume
Archive
Scientific Integrity
Publication Ethics Statements
Interviews with Outstanding Authors
Newsroom
Sponsored Conferences
Podcast
Contact
Special Collections
Submit an Article
Online ISSN: 1945-4589
Research Paper
|
Volume 13, Issue 8
|
pp. 11860–11876
Genetic landscape of breast cancer and mutation tracking with circulating tumor DNA in Chinese women
Back to article
Figure 5
(5 of 8)
−
100%
+
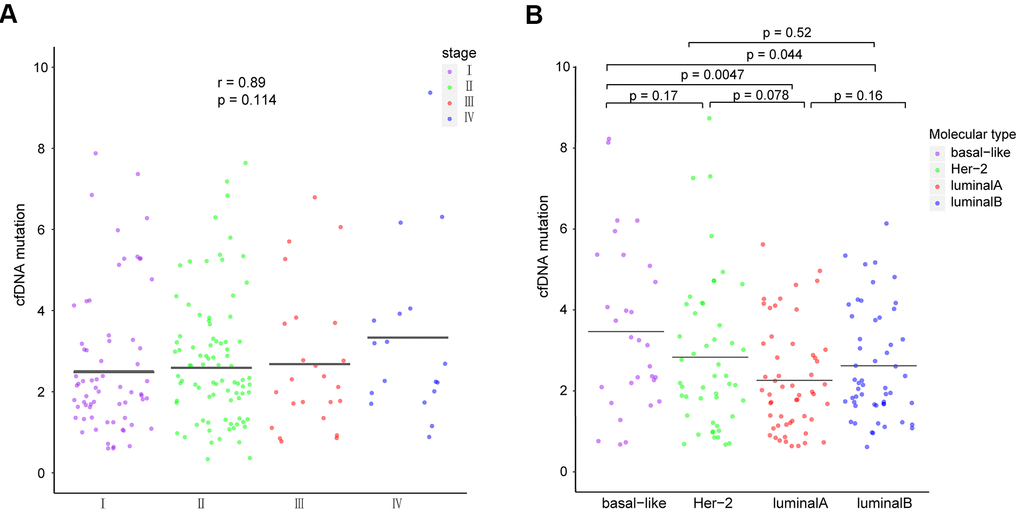
Figure 5.
Comparison of ctDNA among patients with different (
A
) breast cancer stages and (
B
) molecular subtypes. The means of each group are represented by black lines in each column. ctDNA, circulating tumor-derived DNA.