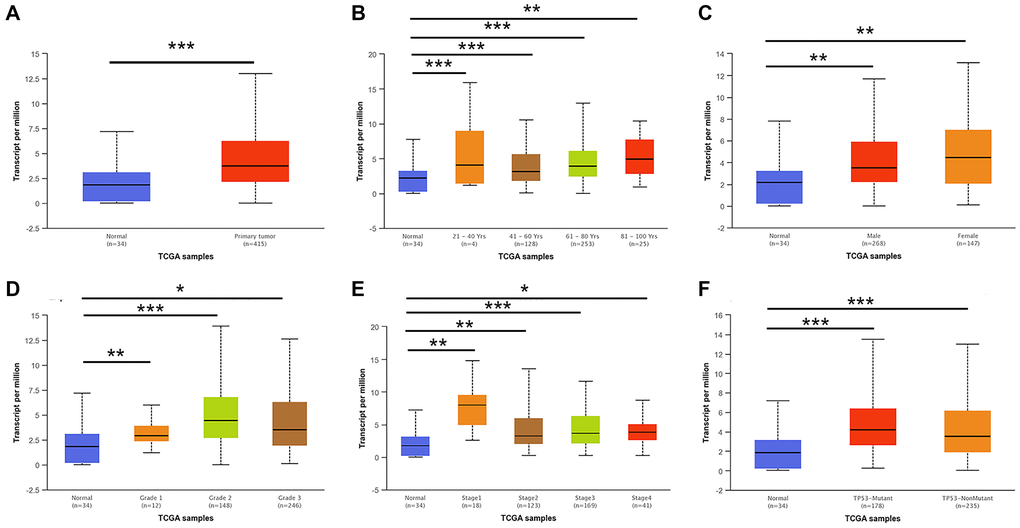
Figure 2.E2F2 mRNA expression in subgroups of patients with GC, stratified based on gender, age and other criteria (UALCAN). (A) Boxplot shows the relative expression of E2F2 in normal and STAD samples. (B) Boxplot shows the relative expression of E2F2 in normal individuals of any age and in STAD patients aged 21-40, 41-60, 61-80, or 81-100 years. (C) Boxplot shows the relative expression of E2F2 in normal individuals of either gender and in male or female STAD patients. (D) Boxplot shows the relative expression of E2F2 in normal individuals and in STAD patients with stage 1, 2, 3 or 4 disease. (E) Boxplot shows the relative expression of E2F2 in normal individuals and in STAD patients with grade 1, 2, 3 or 4 tumors. (F) Boxplot shows the relative expression of E2F2 based on TP53 mutation status. The central mark is the median; the edges of the box are the 25th and 75th percentiles. A t-test was used to estimate the significance of differences in gene expression levels between groups. *P < 0.05; **P < 0.01; ***P < 0.001.