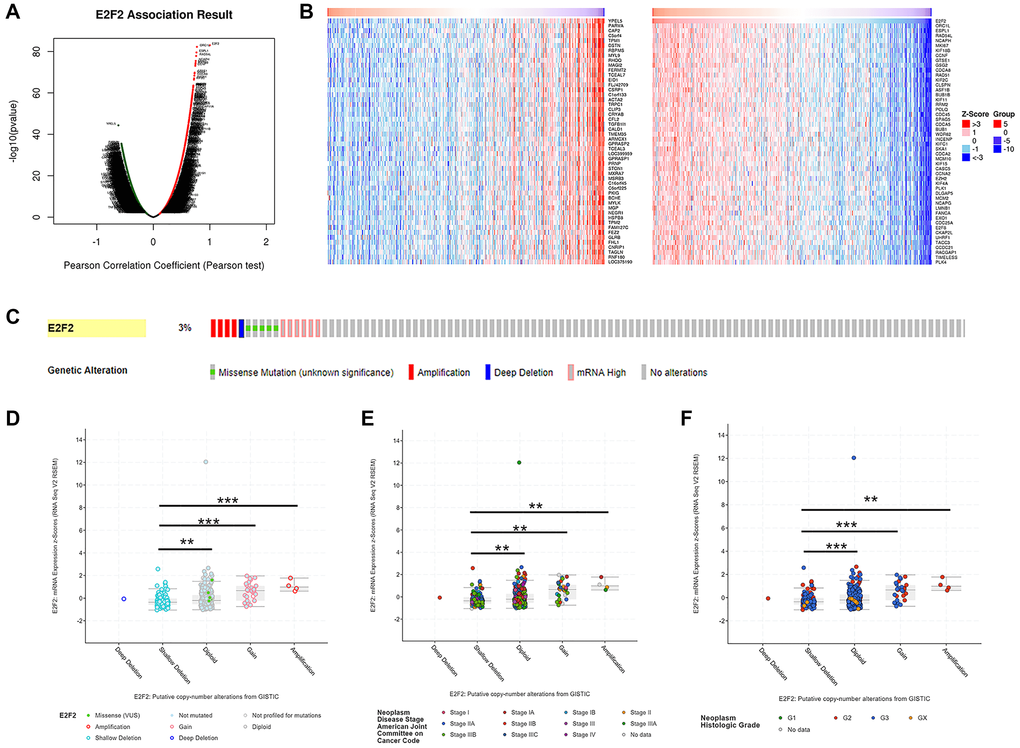
Figure 3.Genes co-expressed with E2F2 (LinkedOmics) and genomic alterations (cBioPortal) in GC. (A) The global genes highly correlated with E2F2 were identified by Pearson test in the STAD cohort. (B) Heat maps show the top 50 genes that were positively and negatively correlated with E2F2 in STAD. Red indicates positively correlated genes and blue indicates negatively correlated genes. (C) OncoPrint of E2F2 alterations in the STAD cohort. The different types of genetic alterations are highlighted in different colors. (D) E2F2 expression in different E2F2 CNV groups. (E and F) Distribution of E2F2 CNV frequency in different stage and grade subgroups. *P < 0.05, **P < 0.01, ***P < 0.001.