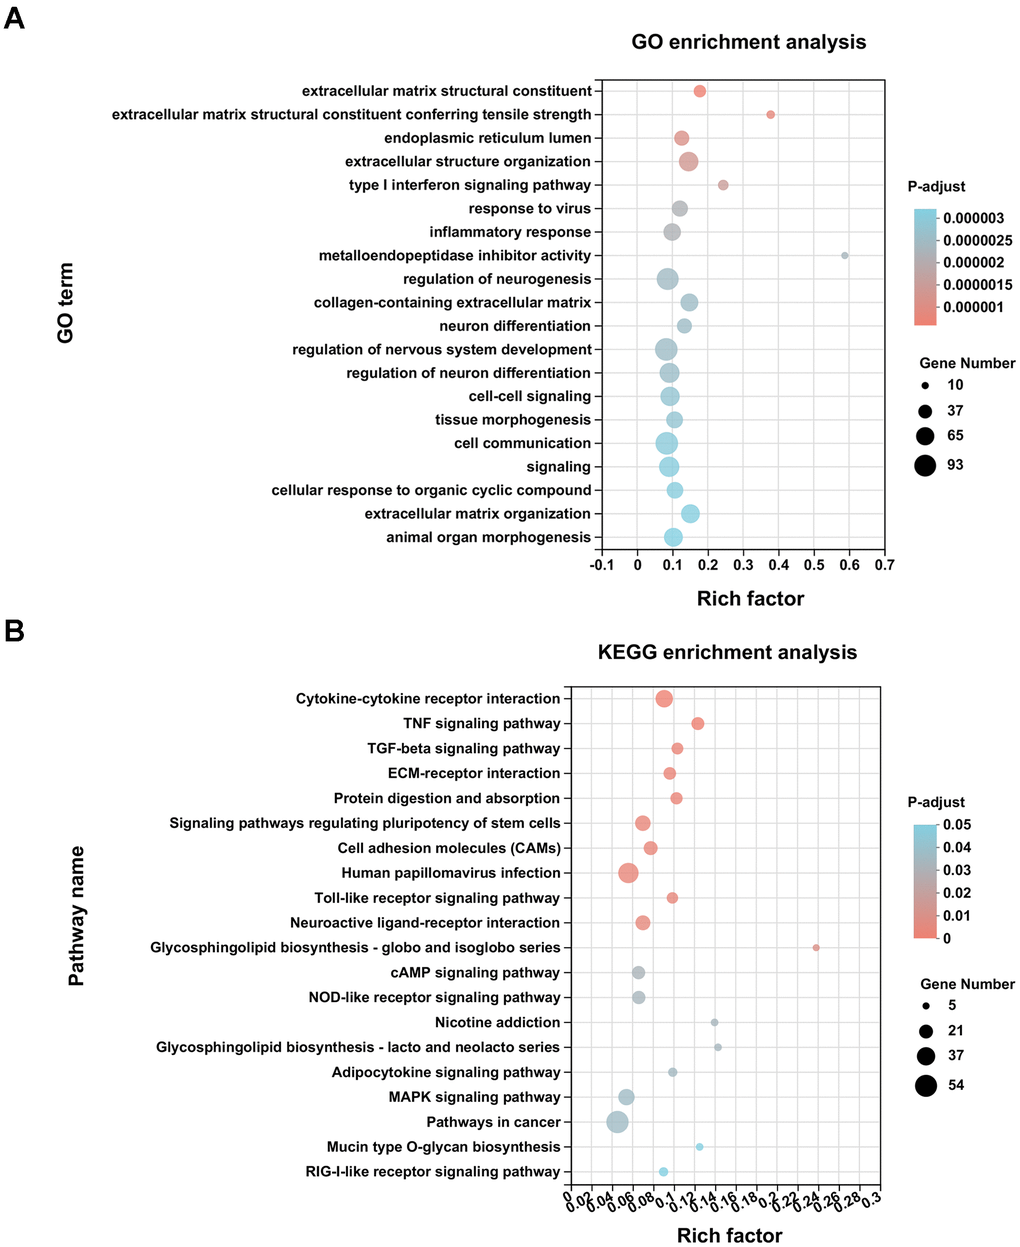
Figure 2.Enrichment analysis of DEGs. (A) GO enrichment analysis of differentially expressed genes (DEGs) was conducted with the top 20 ranked GO terms and shown as a bubble diagram. The vertical axis indicates GO terms and the horizontal axis represents the rich factor. The higher the rich factor, the stronger the enrichment score. The size of dots indicates the number of genes in the GO term, and the color of dots represents adjusted P for different terms. (B) KEGG enrichment analysis of DEGs was performed with top 20 ranked KEGG signaling pathways recognized and shown as a bubble diagram.