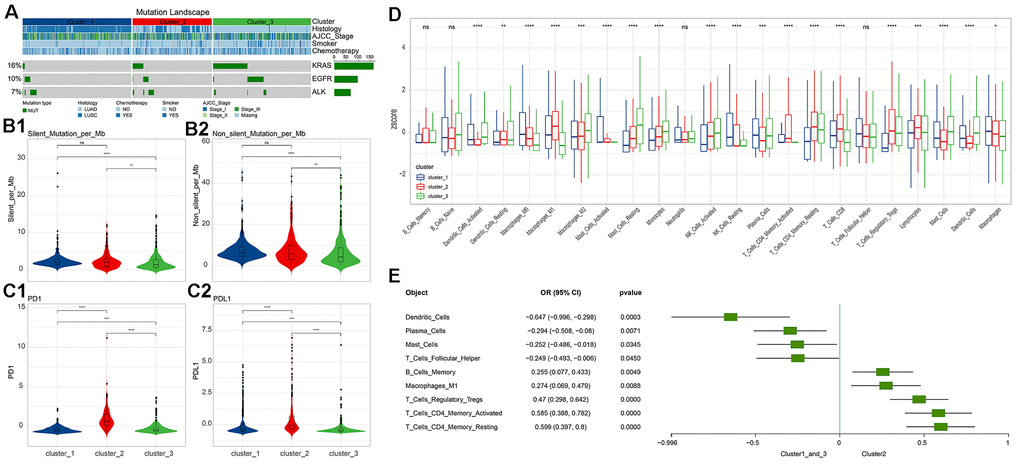
Figure 3.Differences in molecular indicators among immune subgroups and subtype-related immune cell infiltration. (A) Mutation landscape in all clusters. KRAS and EGFR mutations occurred significantly in cluster 3 (chi square test, p<0.05). (B) Tumor mutation burden (Silent and Non-silent) in different clusters. Cluster 3 had the lowest tumor mutation burden. (C) Expression levels of PD-1/PD-L1 in different clusters. Cluster 2 had the highest levels of PD-1 and PD-L1 expression. The numerical statistical test was based on the Wilcoxon rank sum test (*, P<0.05; **, P<0.01; ***, P<0.001; ****, P<0.0001). (D) Differences in immune cell infiltration subtypes. Statistical significance was calculated using the Kruskal-Wallis test (*, P<0.05; **, P<0.01; ***, P<0.001; ****, P<0.0001). (E) Immune cell infiltration significantly associated with cluster 2 (based on logistics regression identification, p<0.05).