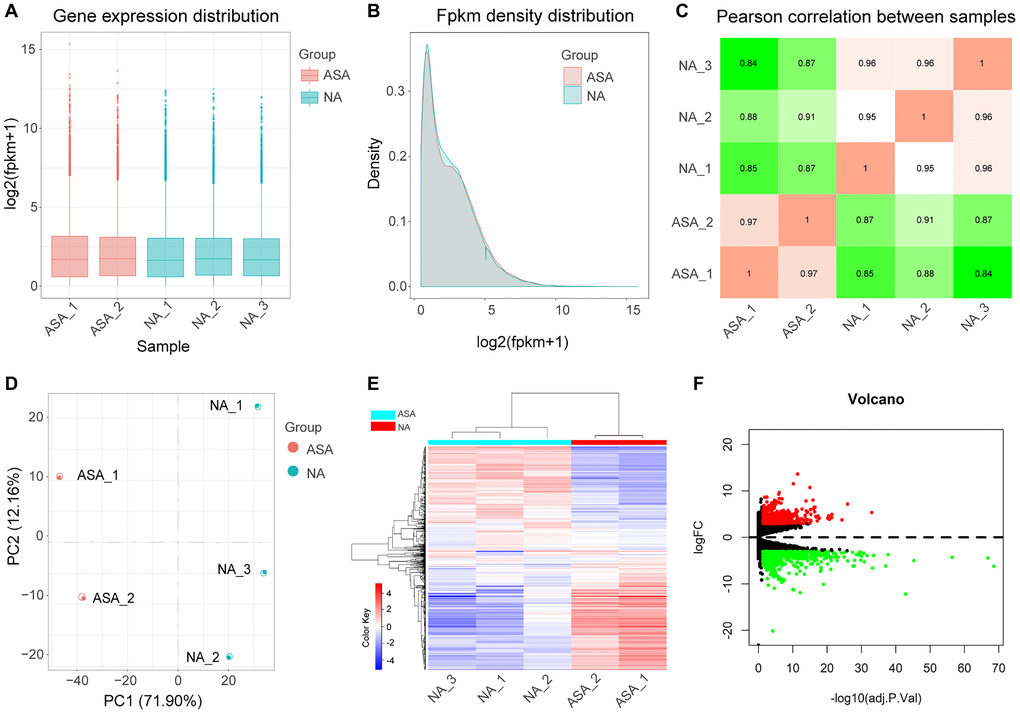
Figure 2.Analysis of DEGs. Boxplot (A) and density plot (B) showing that gene expression levels of different samples are evenly distributed. (C) Correlation diagram of gene expression level between samples indicates that the correlation coefficient between samples of the same group is high and the sample selection is reliable. (D) Principal component analysis diagram (PCA) showing that samples of different groups were significantly different, and samples within the same group were relatively uniform. (E) Heat map of DEGs, red represents high expression, blue represents low expression. (F) Volcano map of DEGs, screening parameters were |logFC|>3, adj.P.Val <0.05, 710 up-regulated genes (red dots), and 717 down-regulated genes (green dots) were identified, genes with no significant changes were labeled as black dots. ASA: Carotid atherosclerosis group. NA: Normal control group. FC: Fold change. Adj.p.Val: corrected p-value.