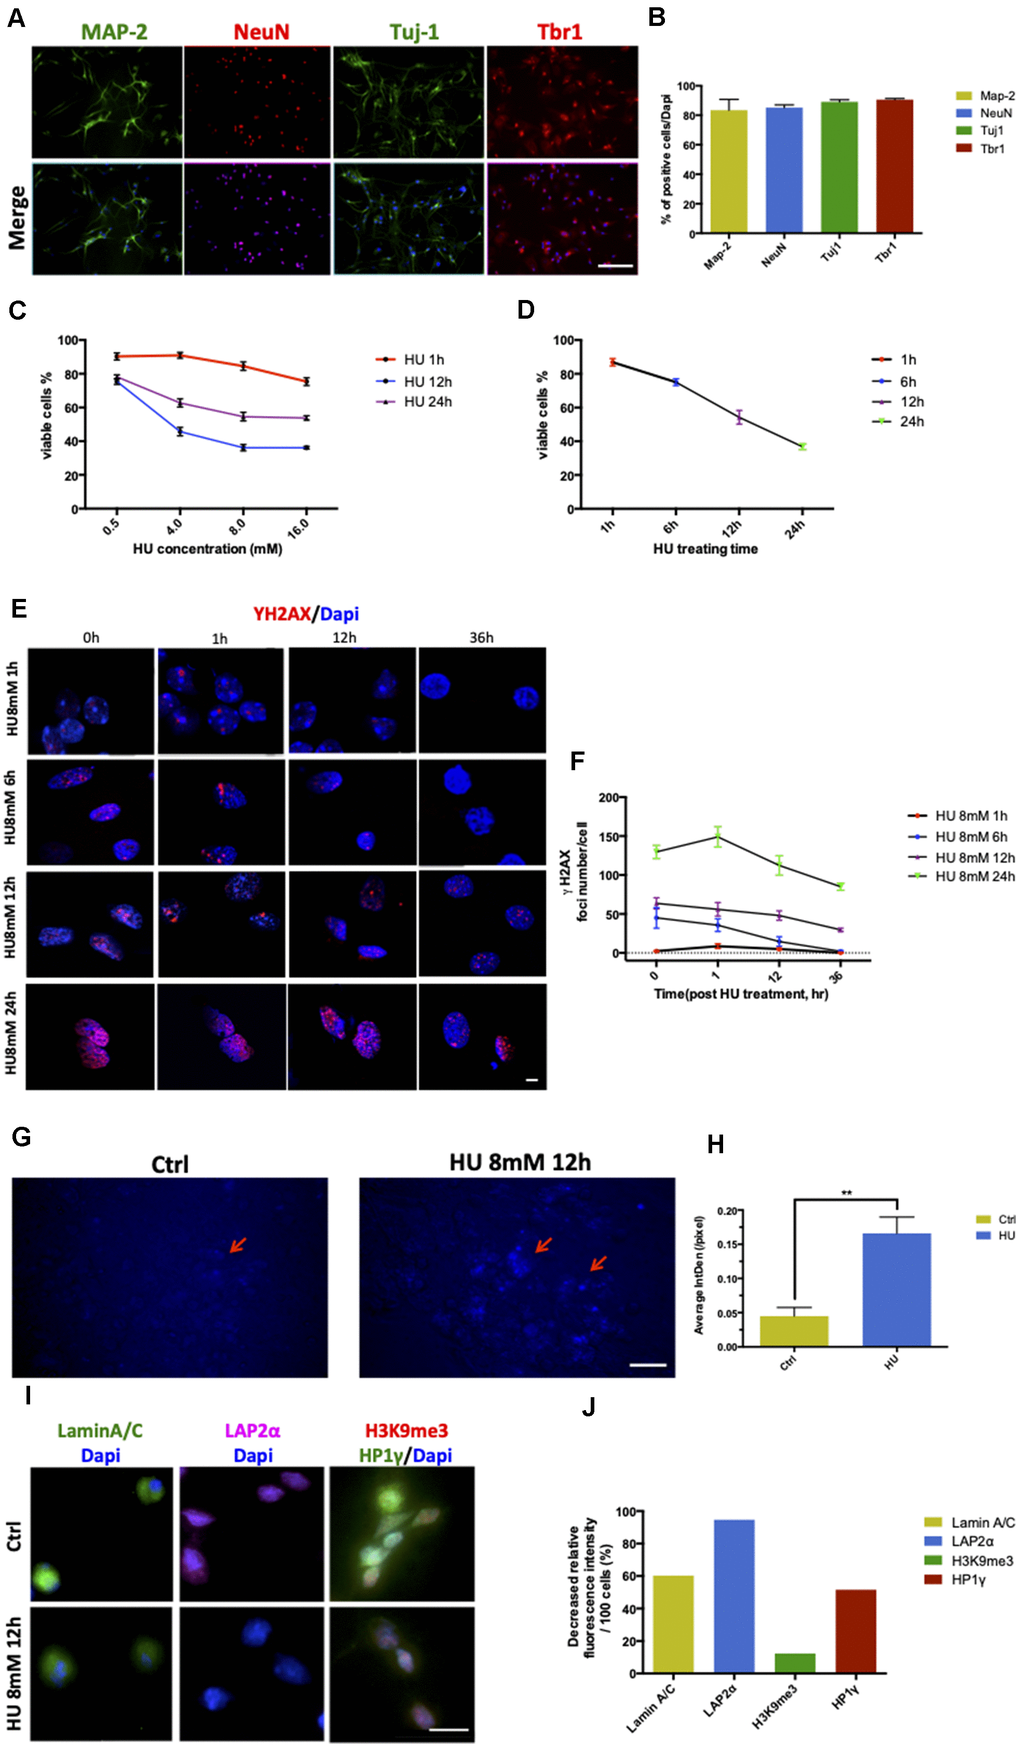
Figure 1.Establishment and characterization of neuronal senescence. More than 80% of rat primary cortical neurons (cultured till day 5) were positively stained with neuronal markers of MAP-2 (green), NeuN (red), Tju1 (green), and Tbr1 (red). Scale bar: 200 μm (A, B). Dose-dependent and time-dependent curves represented neuronal viability using CCK8 test detection (C, D). Formation of DNA double-strand breaks in rat primary cortical neurons (5 days) after HU treatment. Neurons were treated with 8mM HU for 1, 6, 12, and 24 h and allowed to recover until 36 h after treatment. The cells were fixed and stained for γH2AX foci (red) at the indicated time points after HU treatment. Scale bar: 5 μm (E). Graphical quantification of the number of γH2AX foci in neurons treated with 8mM HU for different times over 36 h (F). In vitro staining of total cholesterol (blue) in the 12-h 8mM HU treatment group compared with the control neurons. Scale bar: 500 μm (G). Average fluorescent intensity of the cholesterol-positive cells among control and HU-treated cells. As shown earlier, HU treatment significantly increased the level of blue-staining intensity (P < 0.01) (H). Immunocytochemistry for markers identifying the nuclear lamina (Lamin A/C), a lamina-associated protein (LAP2α), and peripheral heterochromatin (3K9me3, HP1γ) in HU-treated neurons compared with the control ones. Scale bar: 25 μm (I). Quantification of the markers depicted in (I) demonstrated the decreased relative fluorescence intensity per 100 cells in the HU group compared with the control group (J). All the data are expressed as mean ± SD from three independent experiments (N = 3). *P < 0.05, **P < 0.01, ***P < 0.001. The Student t test was used to determine the statistical significance of the differences.