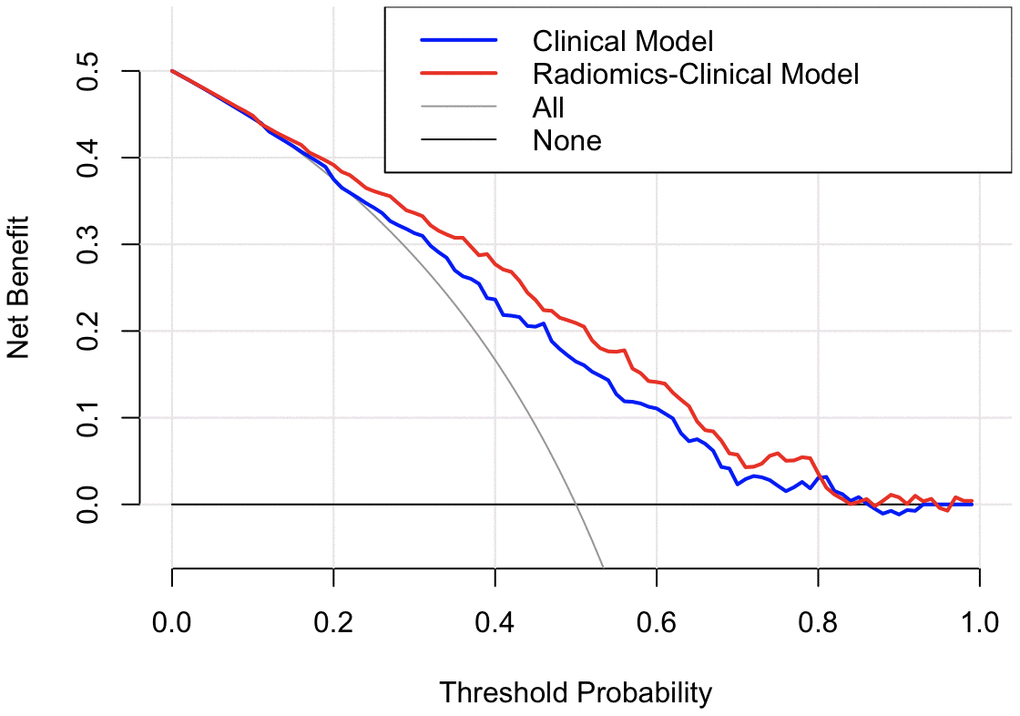
Figure 3.Decision curve analysis for the two models. The y-axis indicates the net benefit; the x-axis indicates threshold probability. The grey line represents the assumption that all patients have IVH growth. The black line represents the assumption that no patients have IVH growth. The blue line and red line represent the net benefit of the single clinical model and radiomics-clinical model, respectively. The radiomics-clinical model had a higher net benefit compared with the single clinical model across most threshold probabilities P represents the prevalence of the disease; R represents the threshold probability; TPR= true positive rate; FPR= false positive rate).