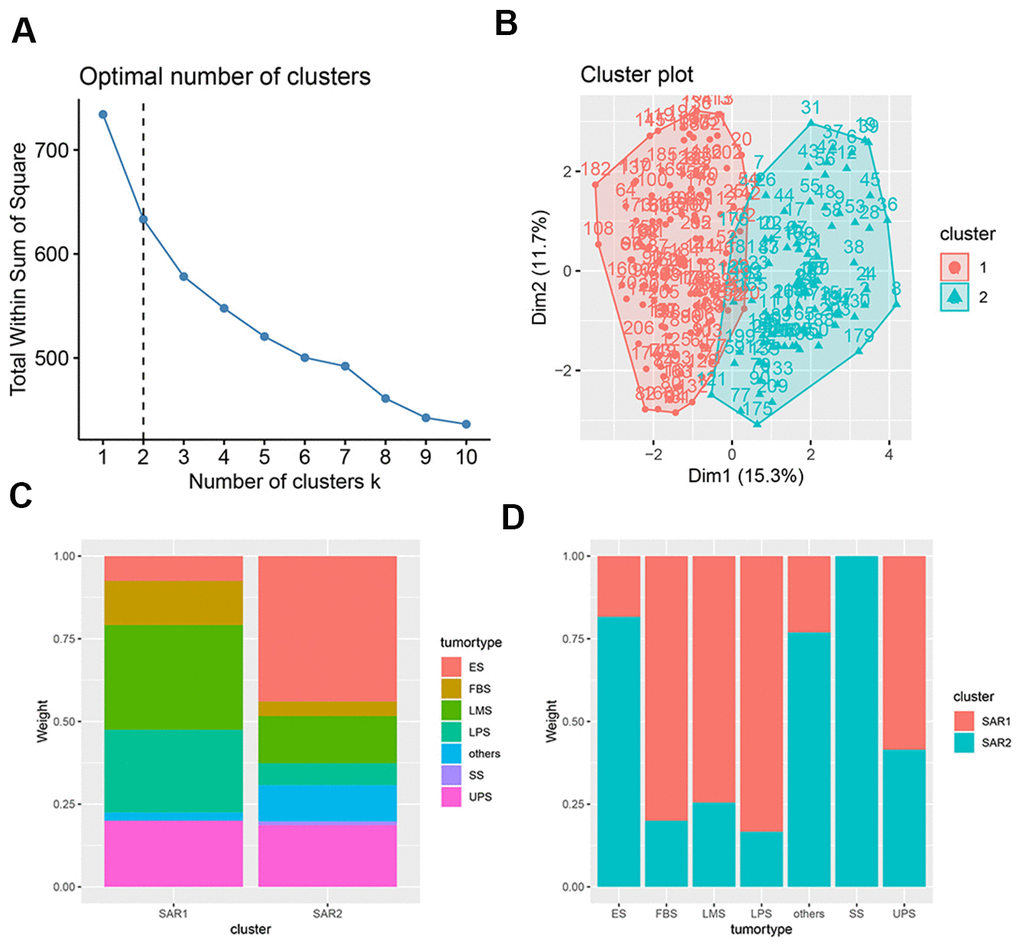
Figure 4.Characteristics of K-means. (A) The selection of optimal clustering number, the dotted line indicates the chosen number; (B) the result of K-means clusters, the results of clustering is shown in two-dimensions, the x axial and y axial represents the characteristics of immune cell infiltration, each dot represents a sample; (C) the tumor proportion in SAR1 and SAR2 group; (D) the cluster proportion in 7 tumor types.