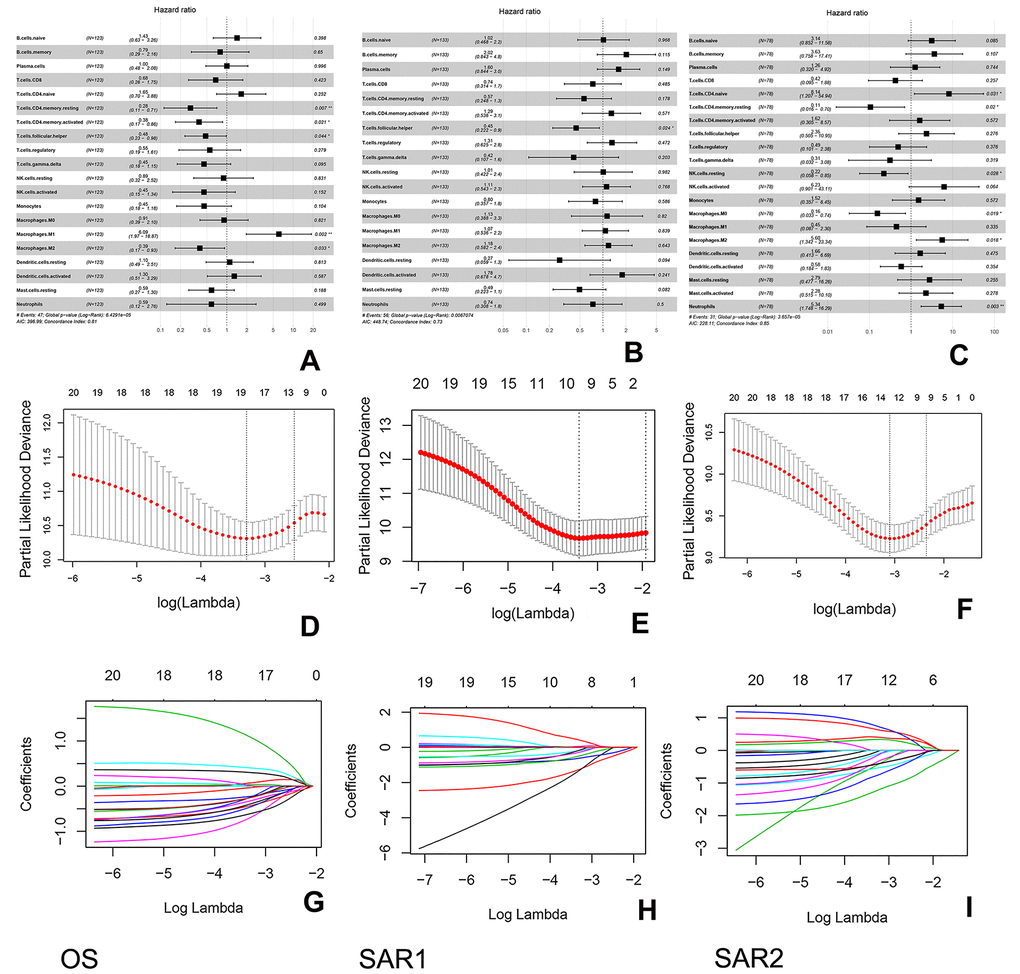
Figure 6.Construction of the immunoscore in 3 groups. (A–C) Forest plots show the association between immune cell subsets and overall survival in 3 groups. The hazard ratios are shown with 95% confidence intervals; (D–F) Tenfold cross-validation for parameter selection in the LASSO model, the partial likelihood deviance is plotted against log (λ). The subscripted values are the value of log (λ), while the superscripted values are the number of parameters. The partial likelihood with error bars representing standard error is shown. The two dotted vertical lines are drawn at the optimal values of log (λ) (minimum criteria and 1-s.e. criteria); (G–I) Least absolute shrinkage and selection operator (LASSO) coefficient profiles of immune cell types. These lines represent the coefficient of the corresponding immune cell.