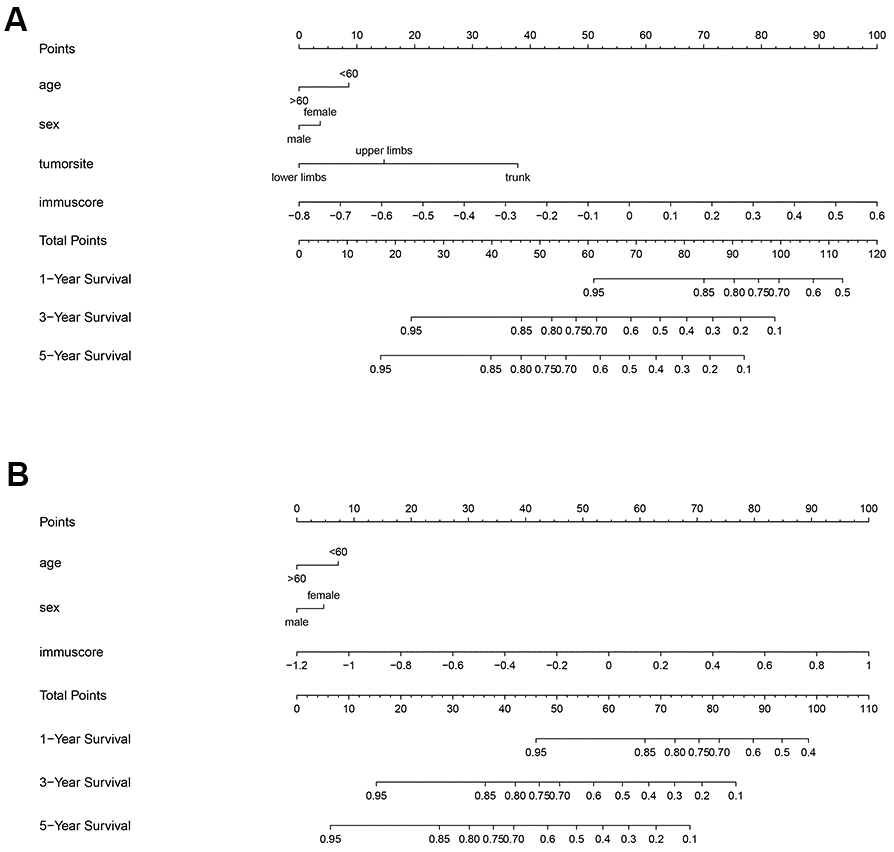
Figure 8.Nomogram of the 2 groups. The first axis shows the reference points of included factors. Points of factors are calculated by the corresponding position in the first axis. The corresponding positions of total points in the last 3 axes indicate the 1, 3 and 5 years survival rate. (A) OS group, (B) SAR2 group.