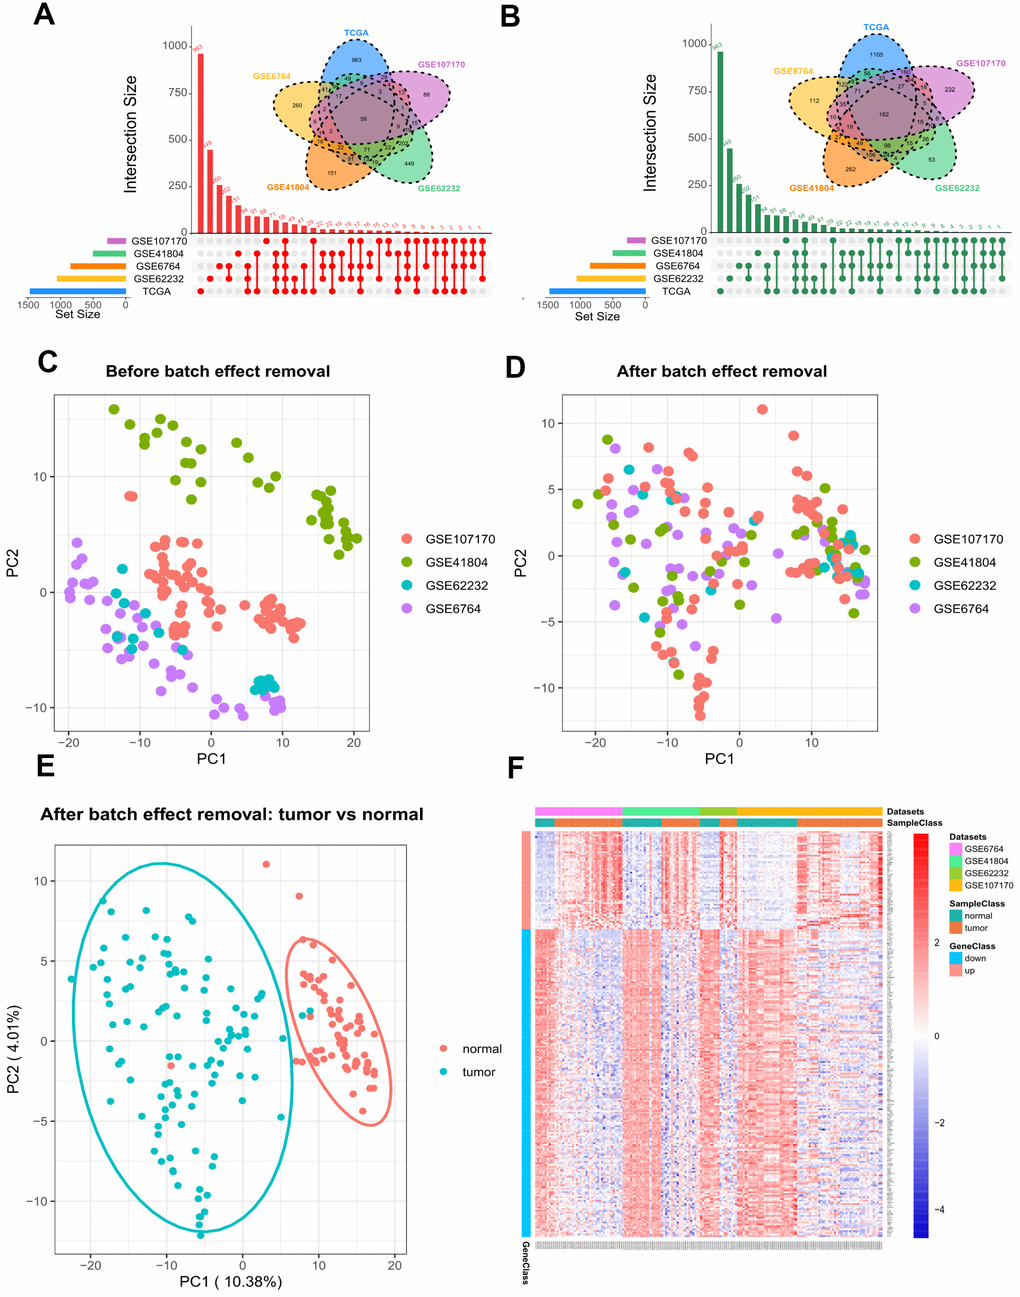
Figure 2.Differential gene expression between HCV-HCC tumor and adjacent normal tissues. (A, B) The combination of Venn plot and Upset plot showing the common upregulated genes (A) and the common downregulated genes (B) in HCV-HCC according to five public datasets. The screening criteria was set as |log Fold change (FC)| > 1 and FDR (adj.P.Val) <0.05. (C, D) Principal component analysis (PCA) for the gene expression profiles from four microarray datasets before (C) and after (D) batch effect removal. The colors represent different datasets. (E) scatter plots visualizing the identified clusters of the tumor and normal samples based on the combined dataset. (F) Heatmap of the 240 DEGs showing their expression values for each patient. The scale bar indicates the gene expression value. Red indicates high expression level, and blue indicates low expression level. HCV-HCC, HCV- associated HCC. DEGs, differentially expressed genes.