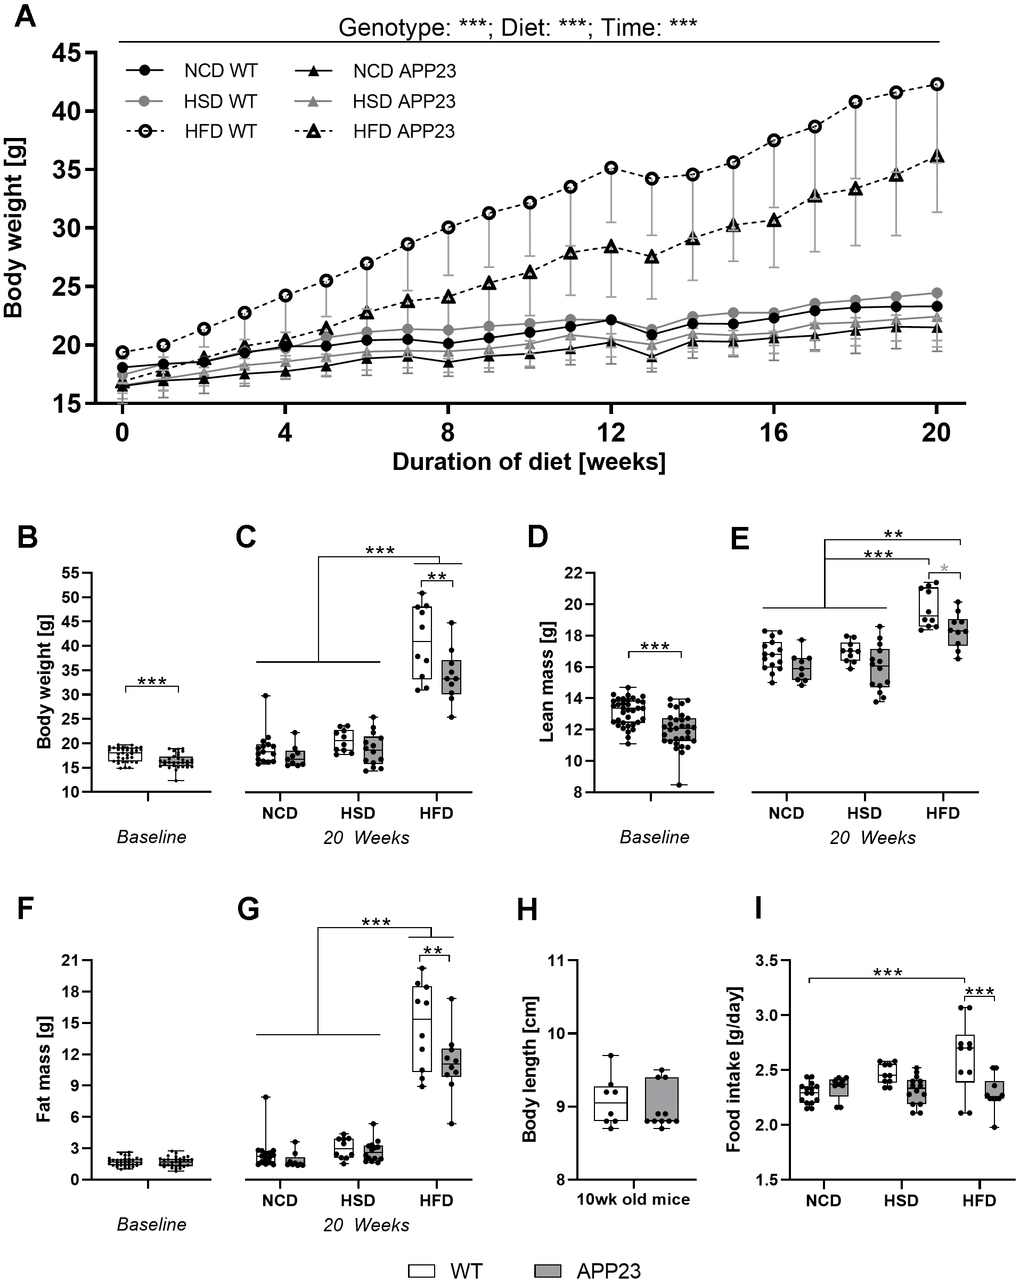
Figure 2.Body weight, body composition, body length, and food intake. (A) Development of body weight during 20 weeks of dietary intervention (NCD, HSD or HFD). (B) Body weight at baseline (week 0). (C) Body weight after 20 weeks of dietary intervention. (D) Lean mass at baseline (week 0). (E) Lean mass after 20 weeks of dietary intervention. (F) Fat mass at baseline (week 0). (G) Fat mass after 20 weeks of dietary intervention. (H) Exemplarily measured body length in male and female adult (mean age 10 weeks) APP23 and WT mice. (I) Mean daily food intake averaged over the entire intervention and across mice occupying the same cage. Data are represented as box (25th to 75th percentile) with median and whiskers from minimum to maximum. Black asterisks indicate significant differences between groups (*: p<0.05; **: p<0.01; ***: p<0.001), gray asterisk indicates a statistical trend towards significance (p<0.1) according to nonparametric ANOVA-type statistics (A), ordinary 2-way ANOVA with Tukey post-hoc test (C, G, I), multiple contrast Tukey-type test (E), or nonparametric t-test (B, D, F, H). nWeek 0 WT=35, nWeek 0 APP23=31, nNCD WT=15, nNCD APP23=9, nHSD WT=10, nHSD APP23=14, nHFD WT=10, nHFD APP23=10; for body length: nWT=8, nAPP23=11.