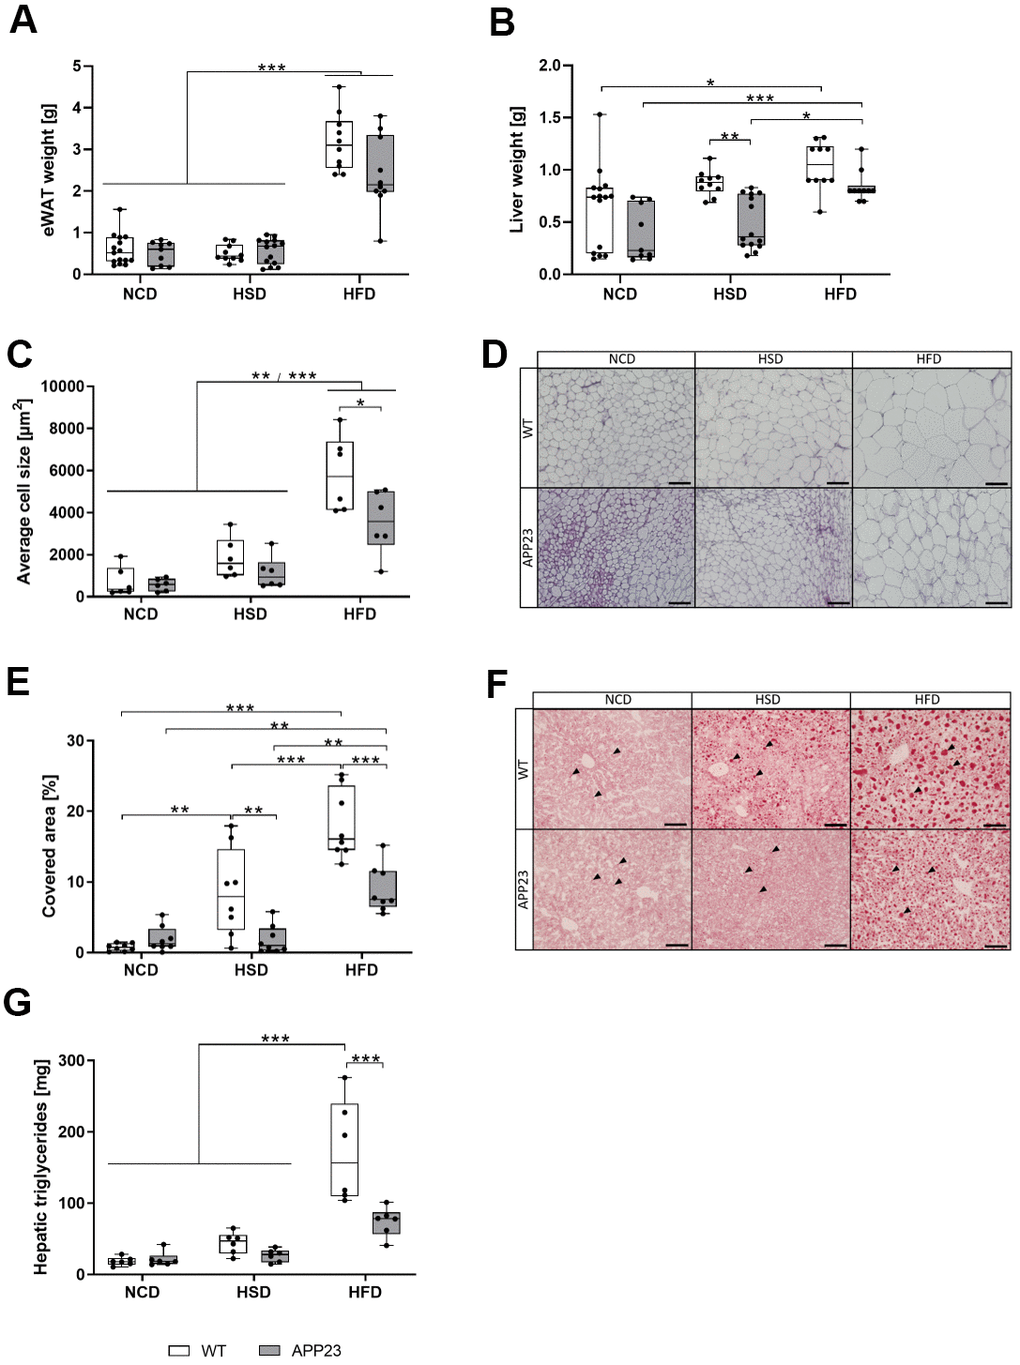
Figure 3.Weight of eWAT and liver, histological analysis of adipocyte size in eWAT and lipid droplets in liver tissue, and quantification of hepatic triglycerides. Weight of eWAT (A) and liver (B) upon sacrifice of mice after 20 weeks of dietary interventions (NCD, HSD or HFD). (C) Quantification of mean adipocyte size in eWAT sections analyzed with ImageJ (D) Representative hematoxylin/eosin stainings of eWAT tissue. Scale bar: 100 μm (E) Lipid quantification of Oil Red O-stained hepatic sections analyzed with ImageJ. (F) Representative Oil Red O stainings of liver tissue. Arrowheads point to individual Oil Red O-stained lipid droplets. Scale bar: 100 μm. (G) Quantification of hepatic triglycerides. Measured triglyceride concentrations were multiplied by liver weight to obtain absolute amounts of triglycerides. Data are represented as box (25th to 75th percentile) with median and whiskers from minimum to maximum. Black asterisks indicate significant differences between groups (*: p<0.05; **: p<0.01; ***: p<0.001), gray asterisk indicates a statistical trend towards significance (p<0.1) according to nonparametric multiple contrast Tukey-type test (A, B) and Tukey post-hoc test of an ordinary 2-way ANOVA (C, E, G). For (A, B) nNCD WT=15, nNCD APP23=9, nHSD WT=10, nHSD APP23=14, nHFD WT=10, nHFD APP23=10. For (C, D) n=6 each. For (E, F) n=8 each, For (G) n=6 each.