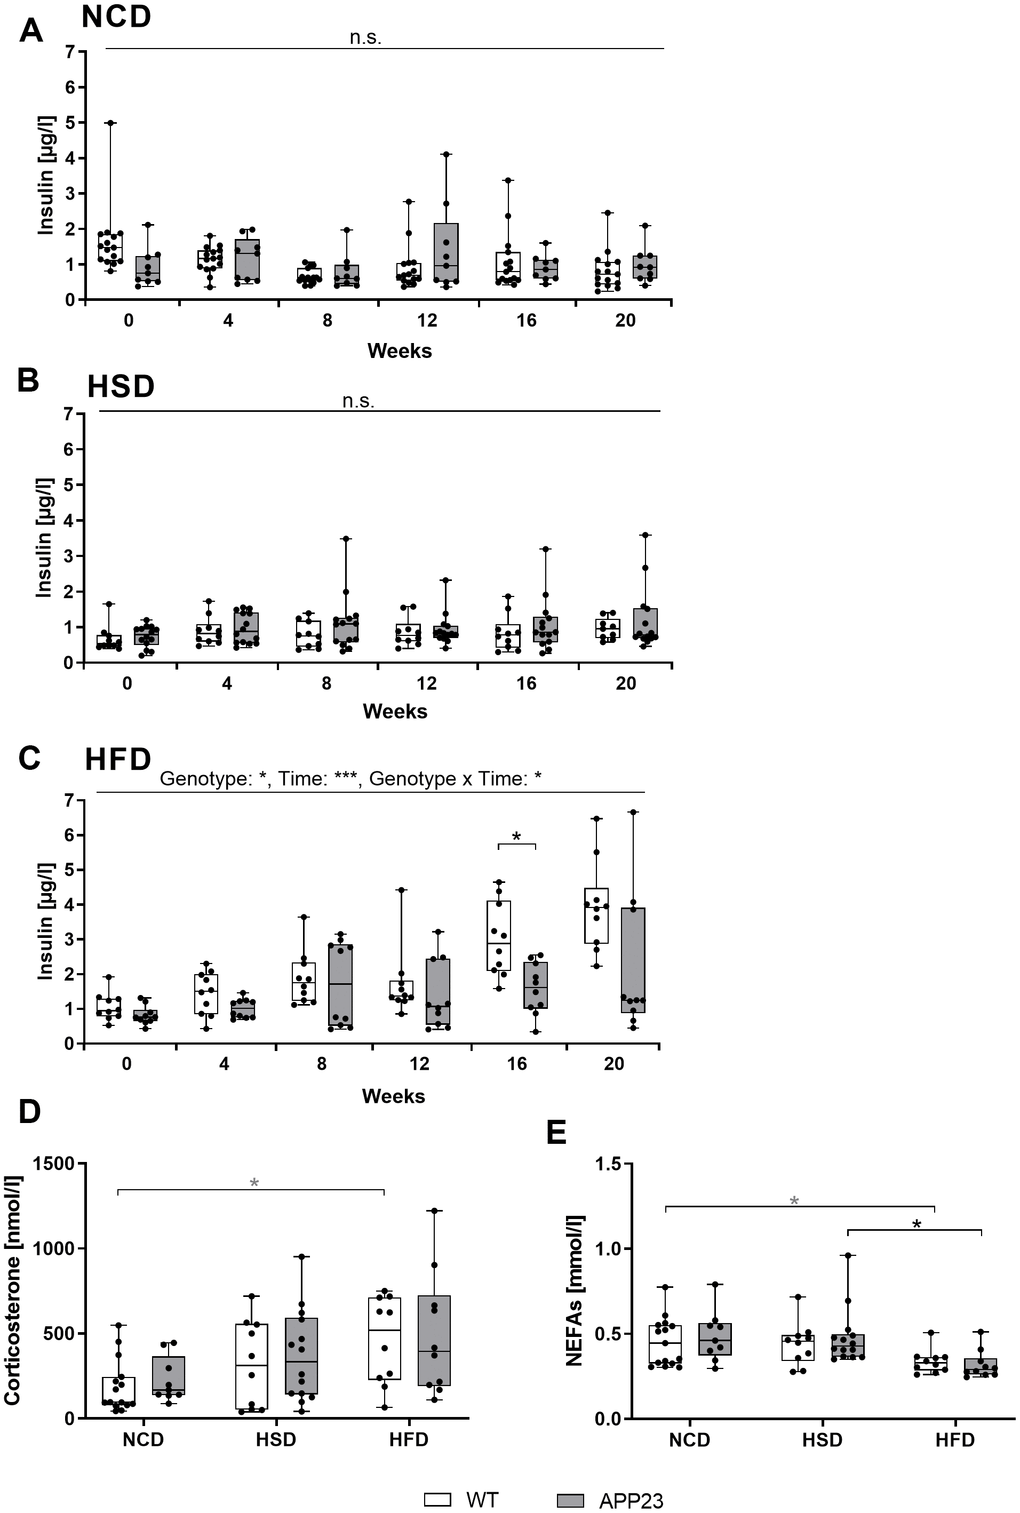
Figure 4.Analysis of basic metabolic parameters in blood of fed mice. (A–C) Plasma insulin measured in NCD-fed (A), HSD-fed (B) and HFD-fed (C) mice at baseline (week 0) and after 4, 8, 12, 16, and 20 weeks of diet. Corticosterone levels (D) and NEFA levels (E) measured in blood plasma obtained upon sacrifice after 20 weeks of diet. Data are represented as box (25th to 75th percentile) with median and whiskers from minimum to maximum. Black asterisks indicate significant differences between groups (*: p<0.05; **: p<0.01; ***: p<0.001), gray asterisk indicates a statistical trend towards significance (p<0.1) according to Tukey post-hoc test of repeated measures ANOVA (A–C) and nonparametric multiple contrast Tukey-type test (D, E). nNCD WT=15, nNCD APP23=9, nHSD WT=10, nHSD APP23=14, nHFD WT=10, nHFD APP23=10.