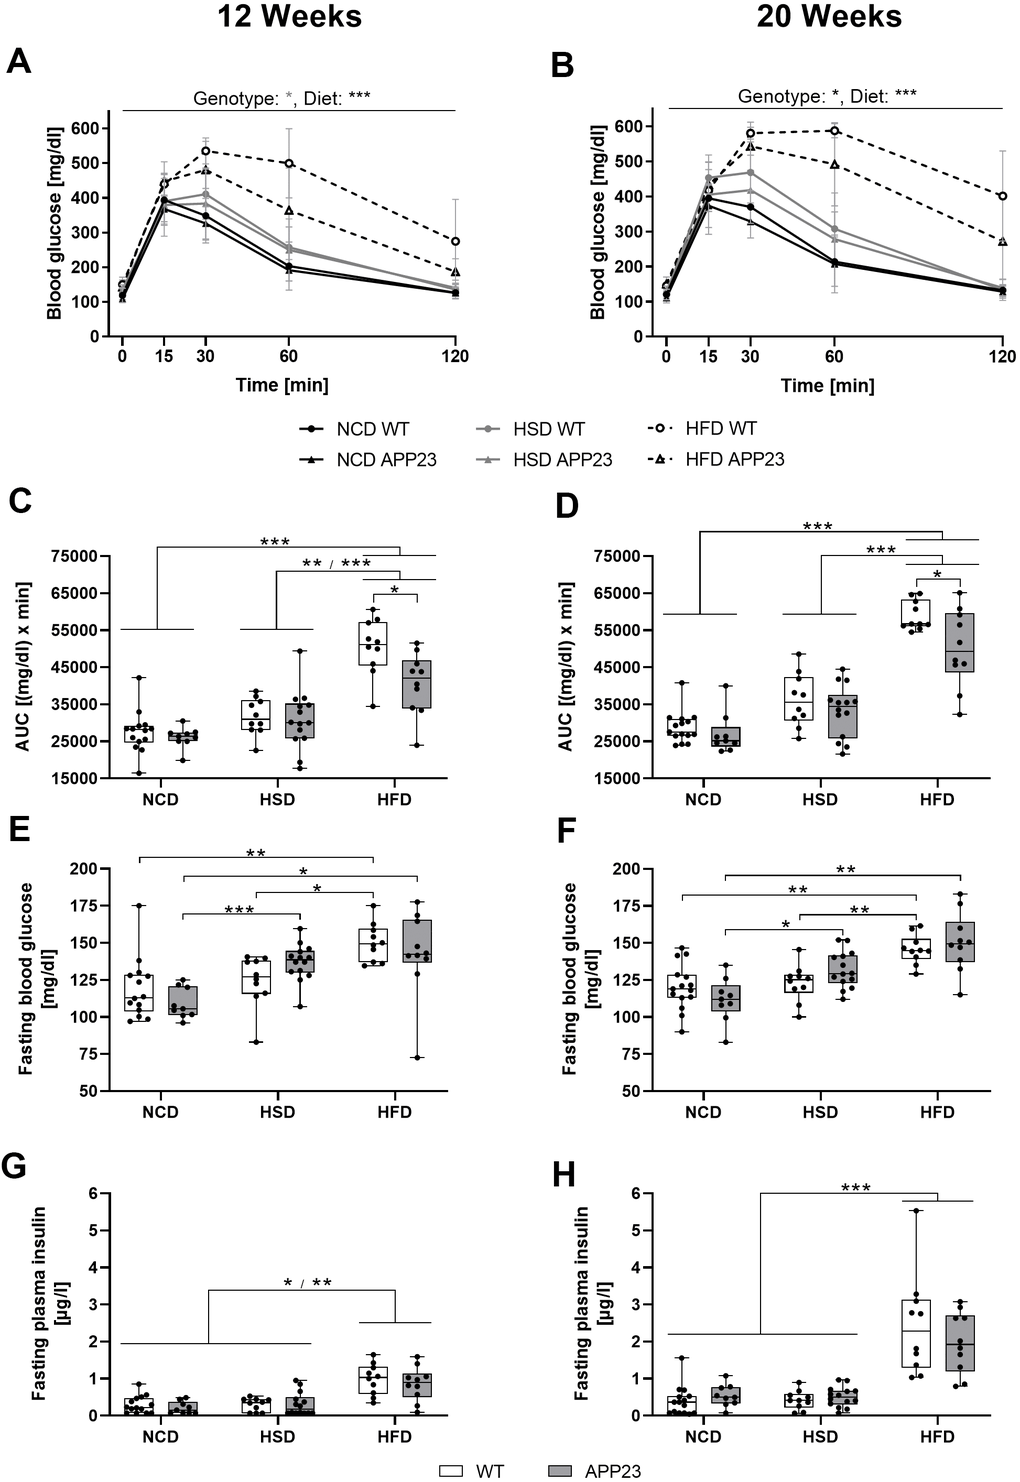
Figure 5.Acute glucose handling and fasting glucose homeostasis after 12 (left column) and 20 weeks (right column) of dietary interventions in APP23 and WT mice. (A, B) Course of blood glucose in an intraperitoneal glucose tolerance test (ipGTT) after 12 (A) and 20 weeks (B) and the corresponding area under the curve (AUC) (C, D). The corresponding basal blood glucose (E, F) and insulin levels (G, H) of WT and APP23 mice were analyzed after 6 h of fasting in the morning. Data are represented as box (25th to 75th percentile) with median and whiskers from minimum to maximum. Black asterisks indicate significant differences between groups (*: p<0.05; **: p<0.01; ***: p<0.001), gray asterisk indicates a statistical trend towards significance (p<0.1) according to nonparametric ANOVA-type statistics (A, B) ordinary 2-way ANOVA with Tukey post-hoc test (C, D) or nonparametric multiple contrast Tukey-type test (E–H). nNCD WT=15, nNCD APP23=9, nHSD WT=10, nHSD APP23=14, nHFD WT=10, nHFD APP23=10.