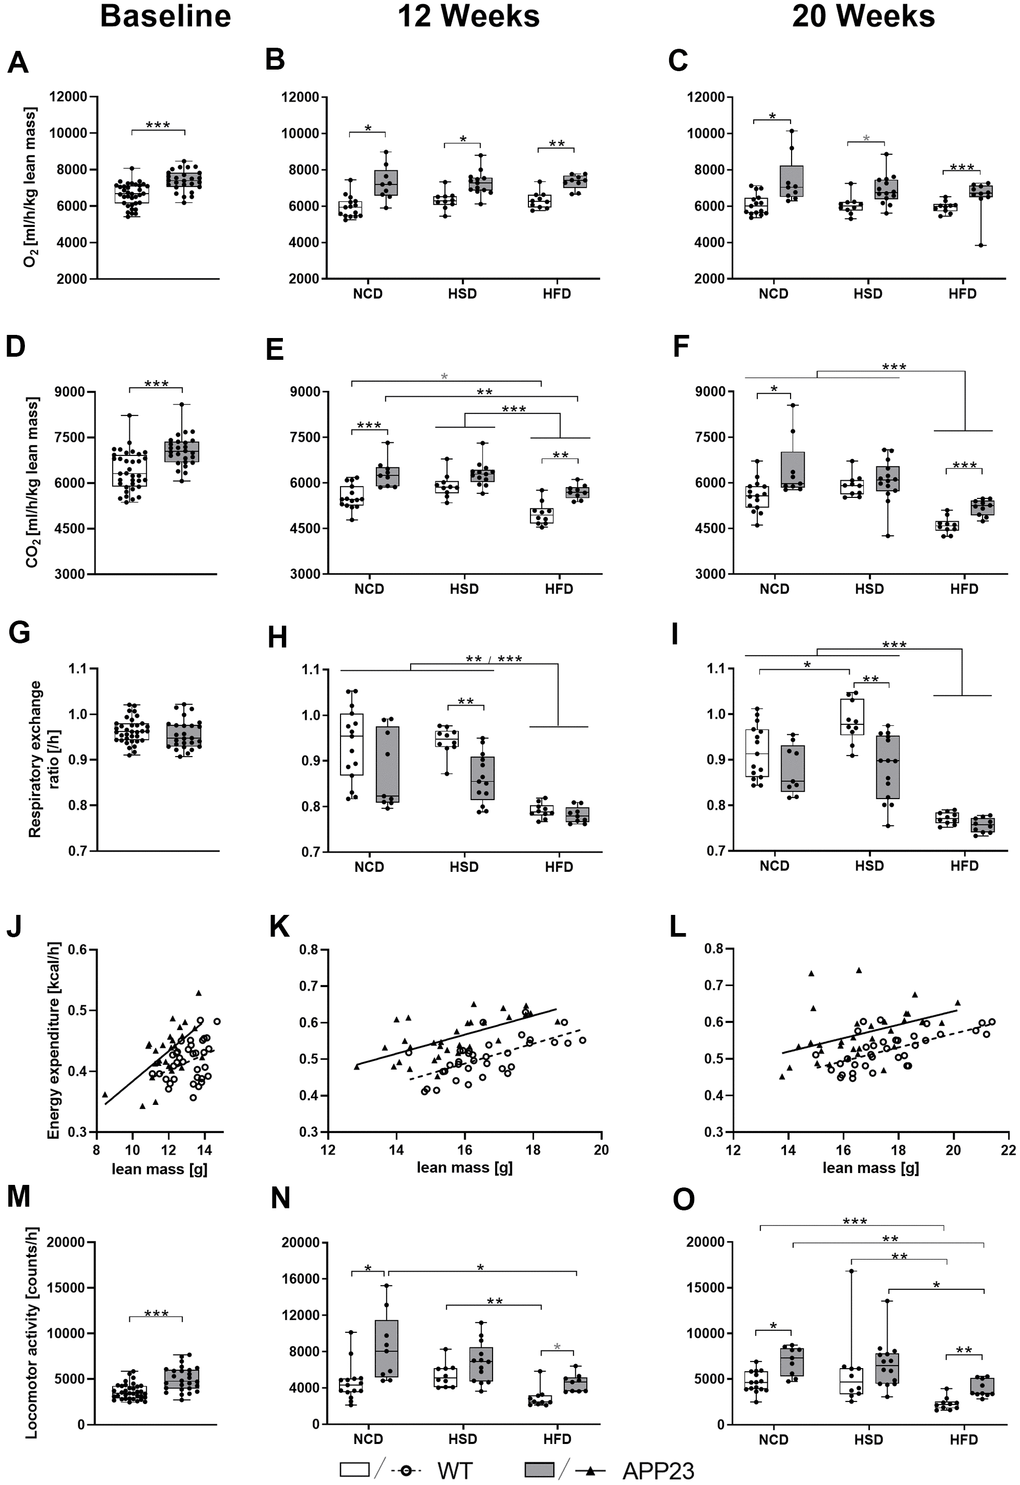
Figure 6.O2 consumption, CO2 production, respiratory exchange ratio, energy expenditure, and activity during active phase at baseline (left column), after 12 (middle column) and 20 weeks of diet (right column). (A–C) Averaged O2 consumption per hour and (D–F) averaged CO2 production per hour (both adjusted for lean mass) as well as (G–I) corresponding mean respiratory exchange ratio. (J–L) Averaged energy expenditure per hour correlated with lean mass and (M–O) averaged locomotor activity per hour. Data are represented as box (25th to 75th percentile) with median and whiskers from minimum to maximum. Black asterisks indicate significant differences between groups (*: p<0.05; **: p<0.01; ***: p<0.001), gray asterisk indicates a statistical trend towards significance (p<0.1) according to nonparametric t-tests (A, D, G, M), nonparametric multiple contrast Tukey-type test (B, C, E, F, H, I, N, O), and Spearman correlation followed by ANCOVA (J–L). nNCD WT=15, nNCD APP23=9, nHSD WT=10, nHSD APP23=14, nHFD WT=10, nHFD APP23=10.