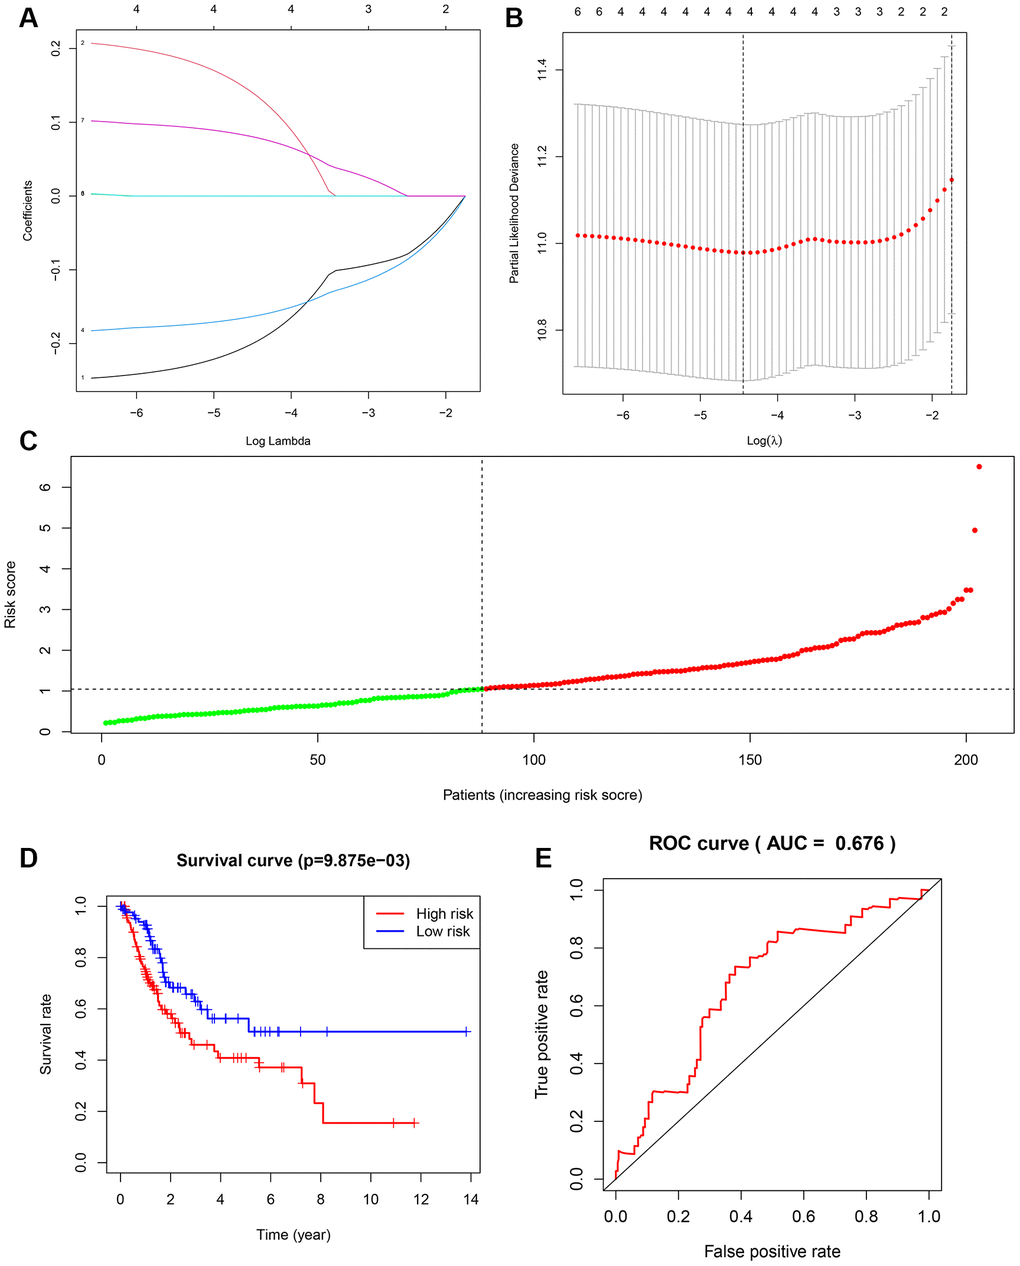
Figure 10.Construction of overall survival risk score model. (A) LASSO coefficient profiles of the genes associated with the DEGs. (B) Partial likelihood deviance was plotted versus log (Lambda). The vertical dotted line indicates the lambda value with the minimum error and the largest lambda value. (C) Risk scores of the patients in the high (red) and low (green) risk groups. (D) Patients of the validation set from TCGA were divided by risk score into high risk and a low risk groups. OS between two risk groups were analyzed and compared by Kaplan-Meier analysis. Red lines represent the high-risk group samples, and blue lines represent the low-risk group samples. (E) ROC curves in the validation set. The abscissa represents sensitivity, and the ordinate represents specificity.