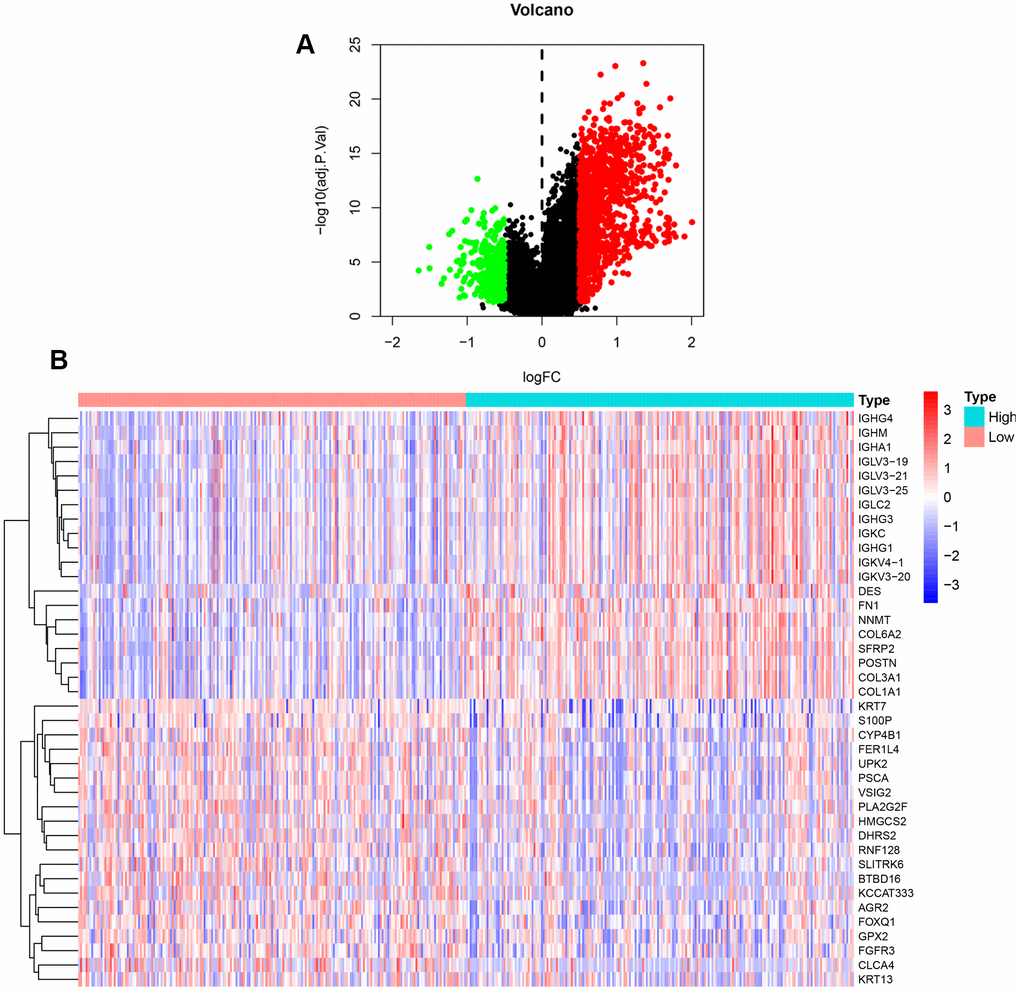
Figure 6.DEGs between high and low expression of NFAT2 groups. (A) Volcanic map for the DEGs identified by R software with limma package. The abscissa represented log2FC, and the ordinate represented the negative logarithm of the P-value. The red, green, and black nodes represented upregulated mRNA, downregulated mRNA, and non-differentially expressed mRNA. (B) Heatmap for the DEGs identified by R software with limma package.