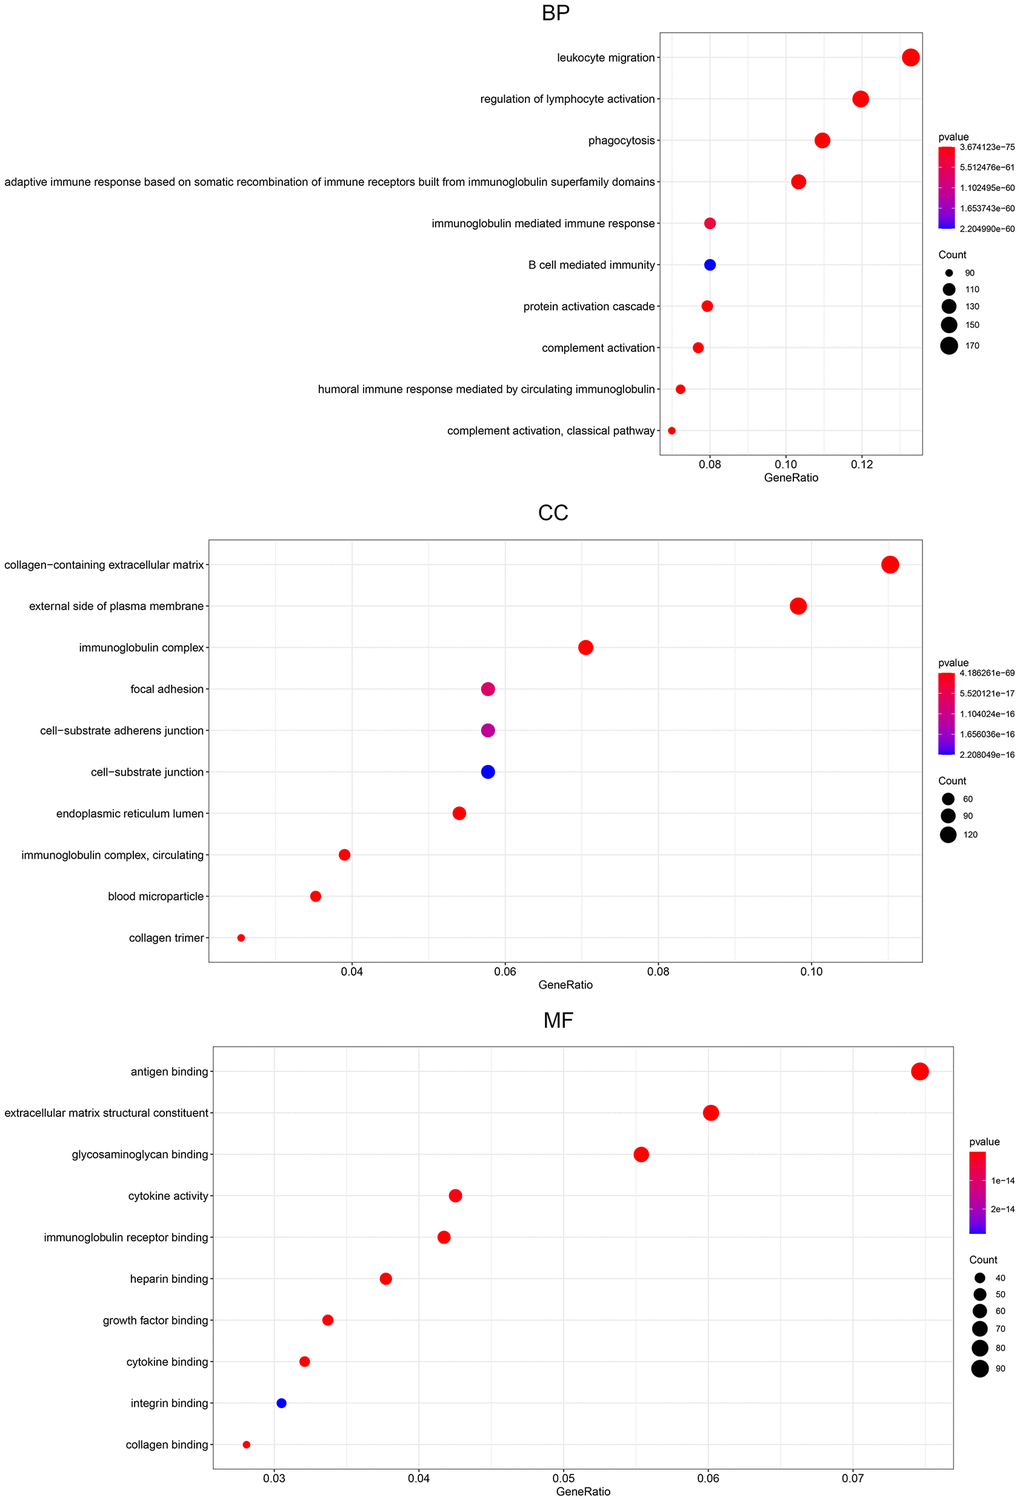
Figure 7.Gene ontology pathway enrichment analysis of DEGs. The rich factor demonstrates the degree of enrichment by GO. The node size represents the number of selected genes, and color represents the P-value of the enrichment analysis. CC, cellular component; MF, molecular function; BP, biological process.