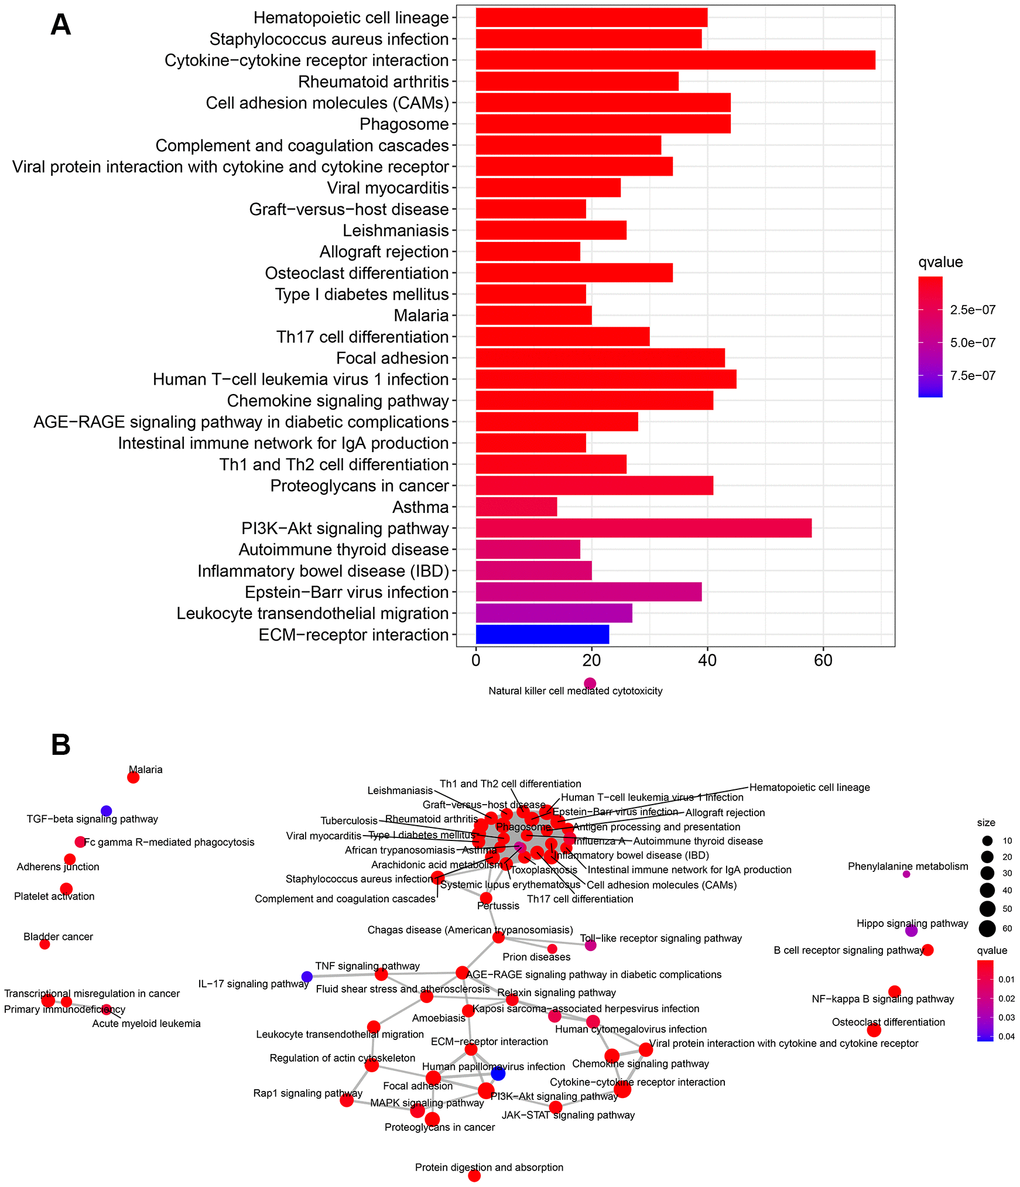
Figure 8.KEGG pathway enrichment analysis of DEGs. (A) The rich factor demonstrates the degree of enrichment by GO. The Node size represents the number of selected genes, and color represents the P-value of the enrichment analysis. (B) Network diagram provides the KEGG pathway interaction in the DEGs.