Submit an Article
Navigate
Home
Editorial Board
Editorial Policies
Current Volume
Archive
Scientific Integrity
Publication Ethics Statements
Interviews with Outstanding Authors
Newsroom
Sponsored Conferences
Podcast
Contact
Special Collections
Submit an Article
Online ISSN: 1945-4589
Research Paper
|
Volume 13, Issue 9
|
pp. 13166–13178
Spontaneous functional changes in specific cerebral regions in patients with hypertensive retinopathy: a resting-state functional magnetic resonance imaging study
Back to article
Figure 3
(3 of 6)
−
100%
+
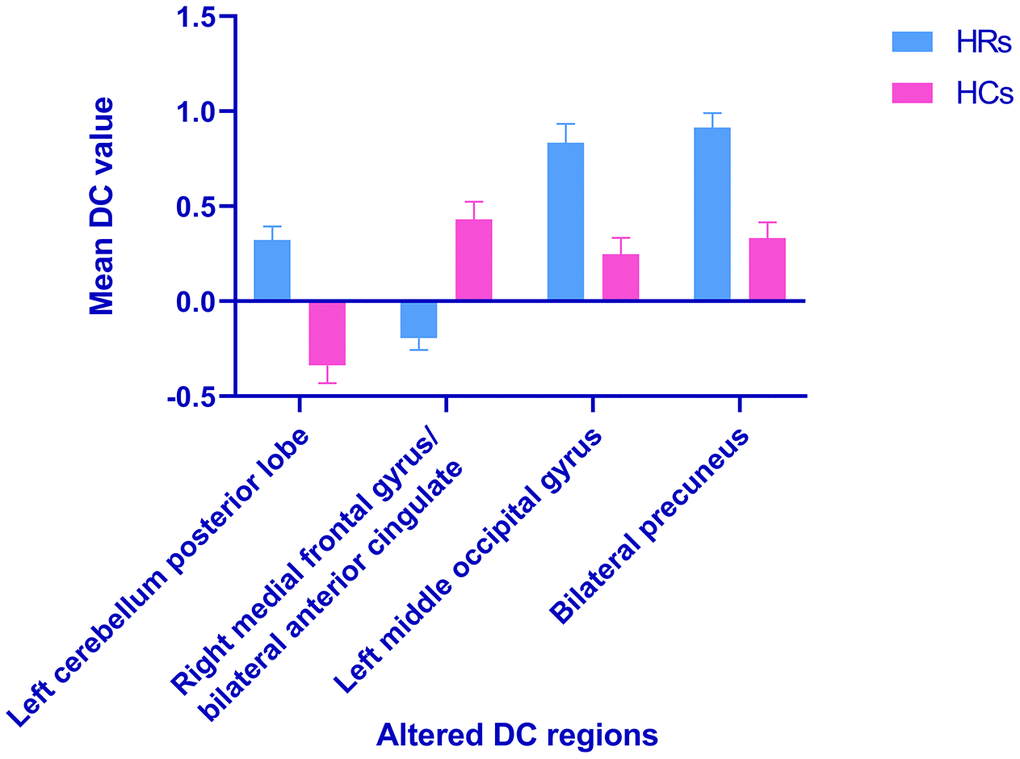
Figure 3.
Voxel-wise comparison of DC in the HR and healthy control group.
Notes: The mean DC values between the HR and HC groups. Abbreviations: DC, degree centrality; HRs, hypertensive retinopathy; HCs, healthy controls.