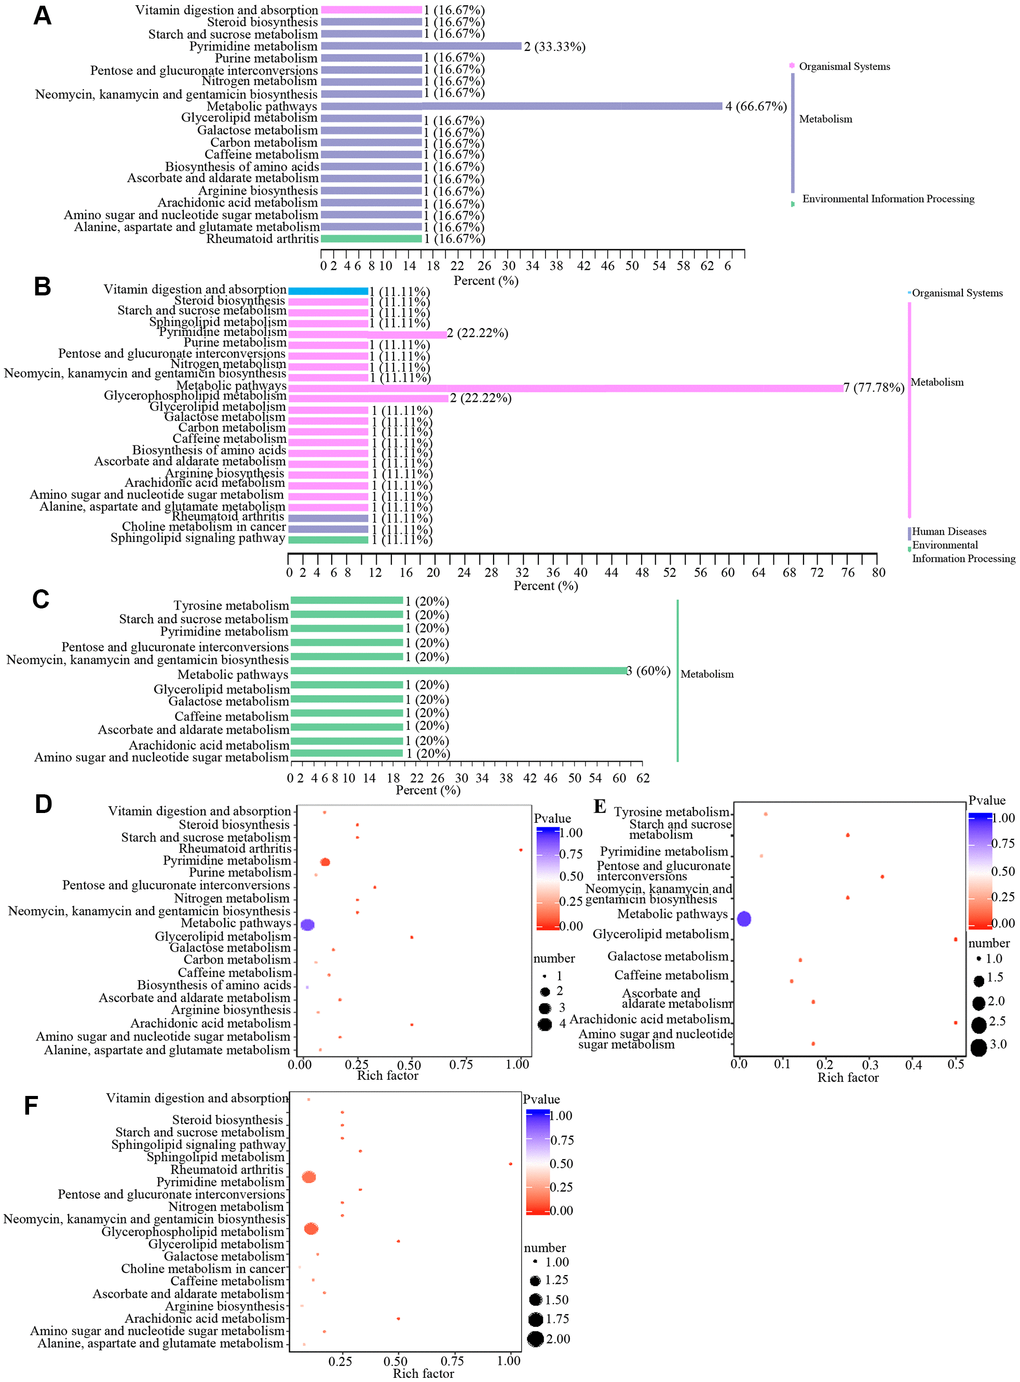
Figure 4.Classification and enrichment of KEGG pathways of differential metabolites in wAMD, CNV, and PCV groups. (A–C) are KEGG classification diagrams of differential metabolites of wAMD vs control, CNV vs control, and PCV vs control, respectively. The ordinate is the name of the KEGG metabolic pathway, and the abscissa is the number of metabolites from the annotation to the pathway and the proportion of the number of metabolites to the total number of annotated metabolites. (D–F) are the KEGG enrichment analysis graphs of differential metabolites wAMD vs control, PCV vs control, and CNV vs control. The rich factor is the ratio of the number of metabolites in the corresponding pathway to the total number of metabolites detected and annotated in the pathways. The larger the value is, the greater the enrichment degree is. The closer the p-value is to 0, the more significant the enrichment is. The size of the midpoint represents the number of significant metabolites enriched in the corresponding pathway.