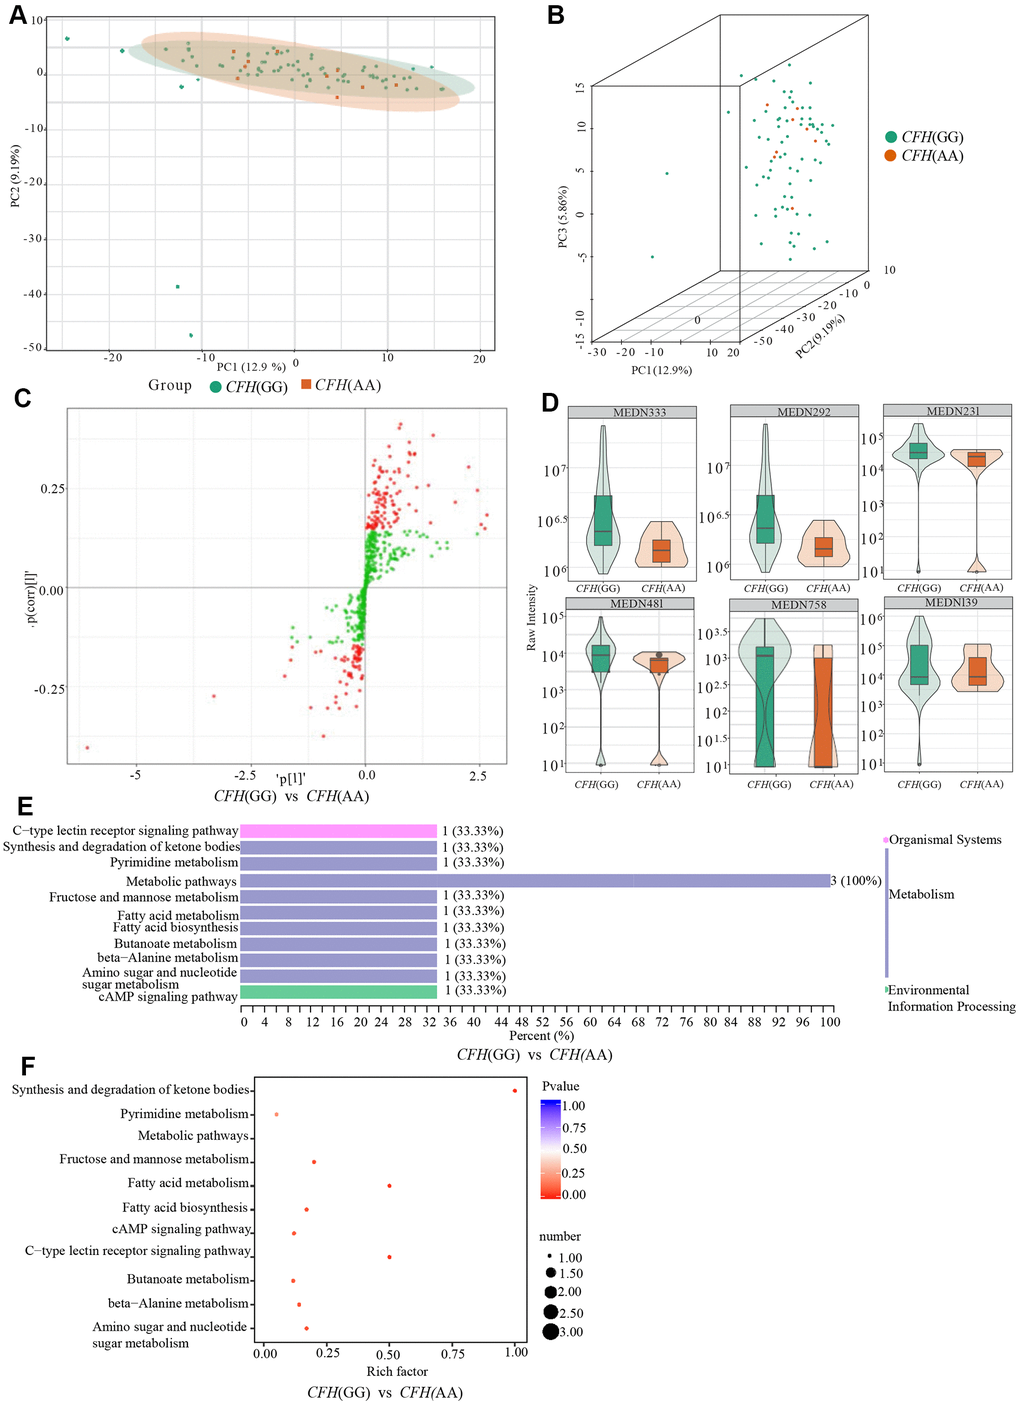
Figure 5.Comparison of genotypes GG and AG of CFH rs800292. (A) shows the two-dimensional PCA map of the degree of variation between the two groups of genotypes GG and AA, and (B) is the 3D images of PCA results of them. (C) is the OPLS-DA S-plot of CFH genotypes GG and AA. The abscissa represents the correlation coefficient of the principal component and metabolite, and the ordinate represents the correlation coefficient of the principal component and metabolite. The red dots indicate that the metabolites have VIP values greater than or equal to 1, and the green dots indicate that the metabolites have VIP values less than 1. (D) shows Relative contents of differential metabolites between CFH genotypes GG and AA. (E, F) are the results of KEGG classification and enrichment of differential metabolites between-group genotypes GG and group AA of CFH.