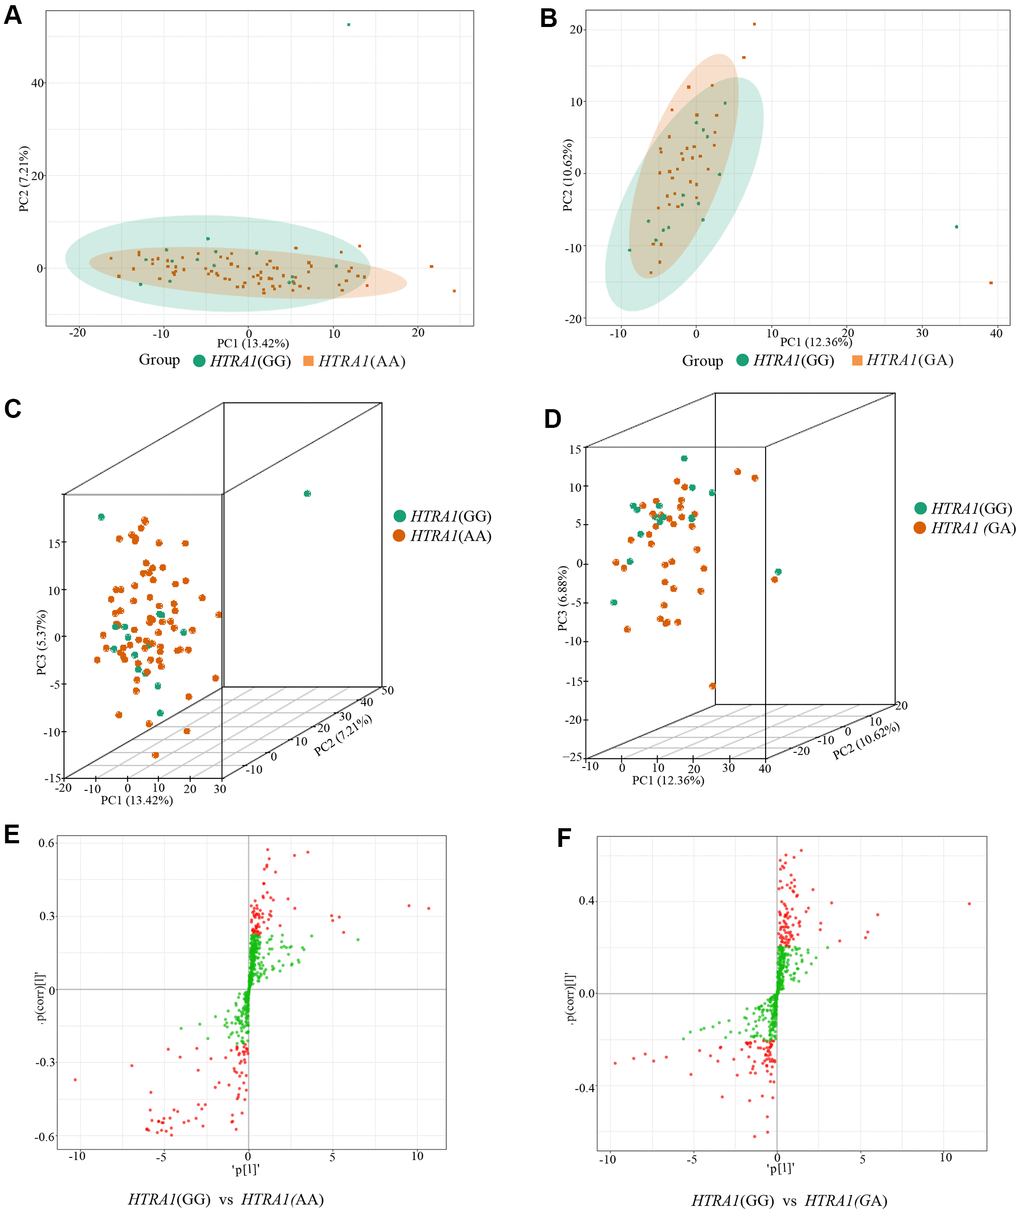
Figure 6.PCA results and OPLS-DA S-plot of three HTRA1 rs10490924 genotypes. (A, B) show the two-dimensional PCA map of the degree of variation between the two groups of genotypes GG and AA, GG and GA. (C, D) are the three-dimensional PCA map. From the graphs, we can see that the degree of variation between genotypes GG and AA or between genotype GG and GA is relatively small. (E, F) are OPLS-DA S-plot of three HTRA1 genotypes compared among groups. (E) shows the results of HTRA1 genotypes GG and AA, and (F) shows the results of GG and GA. This diagram mainly shows the number of metabolites whose VIP value is greater than or less than 1 in the detected metabolites between groups. The abscissa represents the correlation coefficient of the principal component and metabolite, and the ordinate represents the correlation coefficient of the principal component and metabolite. The closer the metabolite is to the upper right corner and the lower-left corner, the more significant the difference is. The red dots indicate that the metabolites have VIP values greater than or equal to 1, and the green dots indicate that the metabolites have VIP values less than 1.