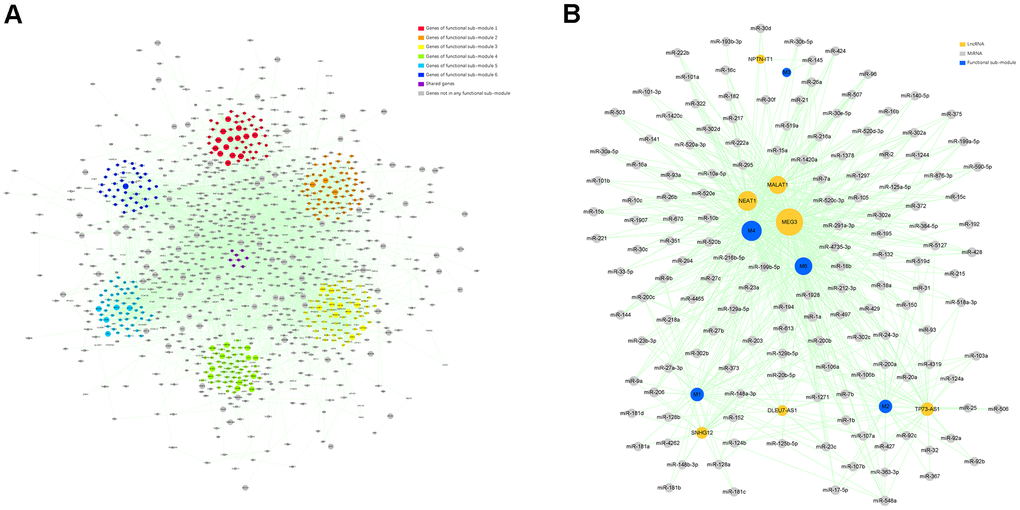
Figure 4.Identification of the functional sub-modules and construction of a ceRNA network. (A) The PPI network containing 6 functional sub-modules in the target module. Red nodes indicate genes in functional sub-module 1; “orange” indicates genes in functional sub- module 2; “yellow” indicates genes in functional sub-module 3; “green” indicates genes in functional sub-module 4; “bule” indicates genes in functional sub-module 5; “indigo” indicates genes in functional sub-module 6; “purple” indicates genes shared by over 2 functional sub-modules; and “gray” indicates genes not belonging to any functional sub-module. The size of certain node reflects the corresponding gene’s MM value. (B) A ceRNA network describing lncRNA–miRNA–functional sub-module interaction. “Indigo” indicates functional sub-module; “orange” indicates lncRNA; and “gray” indicates miRNA. The size of certain node reflects its degree value in the network.