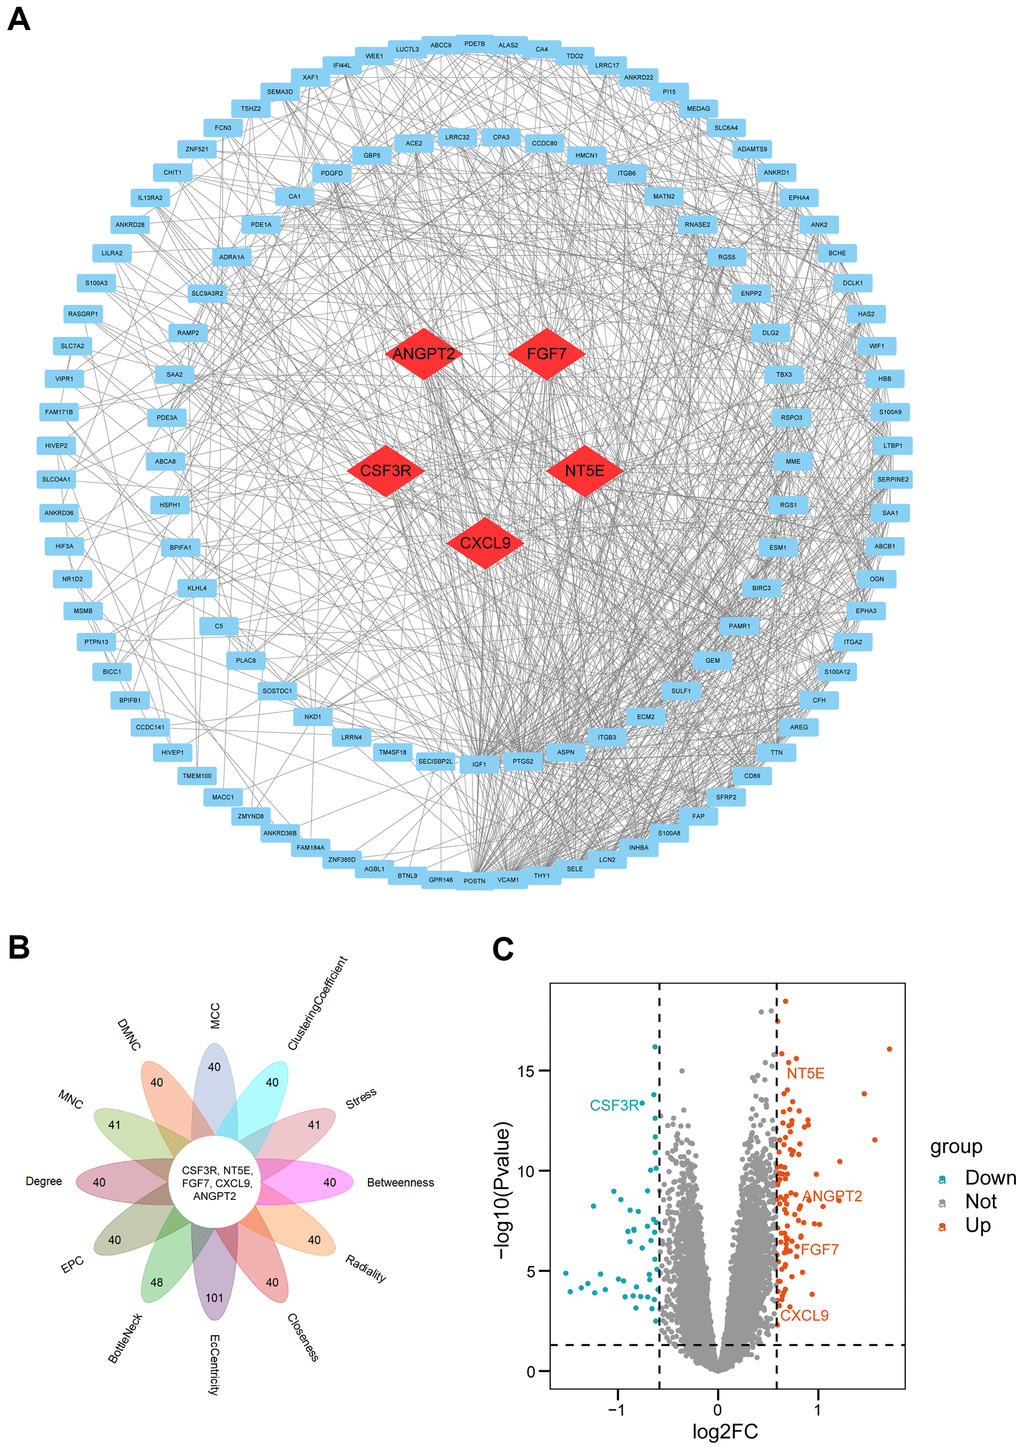
Figure 4.PPI network construction and hub genes analyses. (A) PPI network. Quadrangles represented proteins and lines represented interactions between proteins. hub genes were in red color. (B) Flower plot of results from twelve algorithms. (C) Volcano plot of all genes. Orang dots represented 103 up-regulated genes and cyan dots represented 48 down-regulated genes. CSF3R, NT5E, ANGPT2, FGF7, CXCL9 marked in the figure were hub genes. PPI: protein-protein interaction.