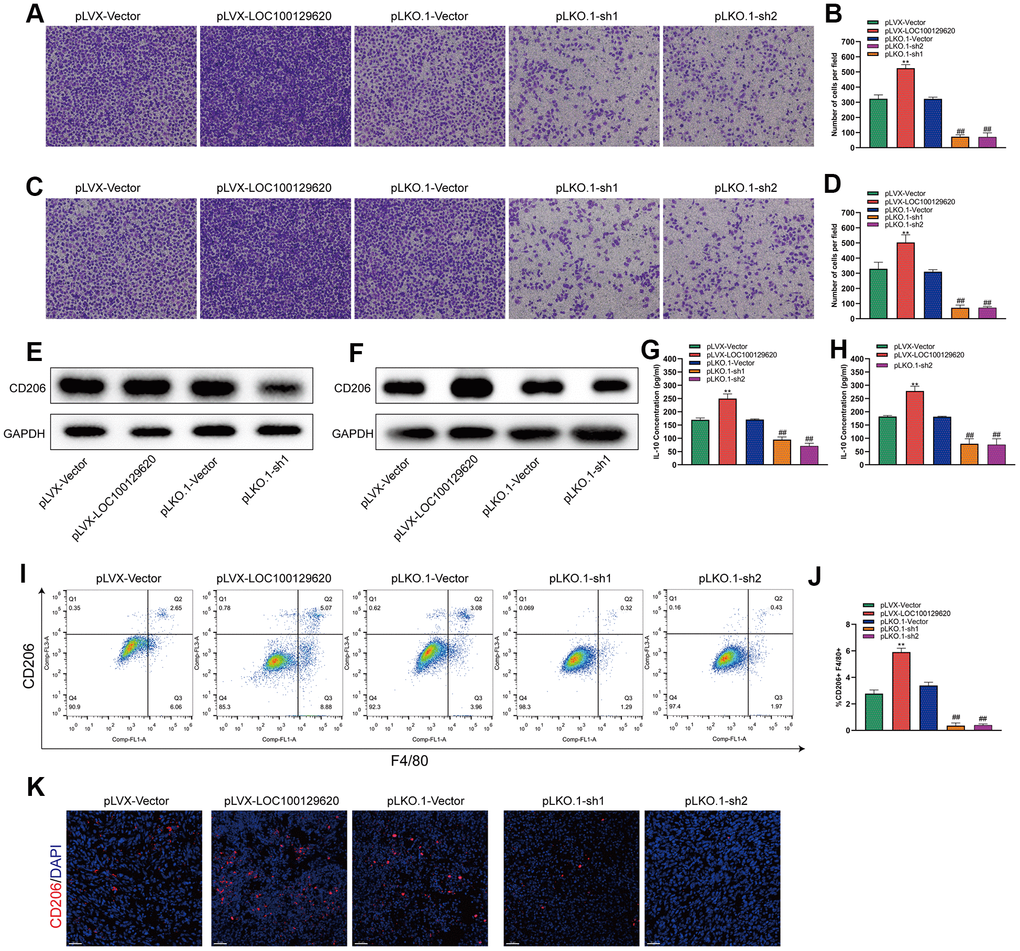
Figure 8.LncRNA LOC100129620 regulates osteosarcoma-associated macrophage polarization. (A) Transwell assay to detect the invasion ability of RAW264.7 cells treated with cell culture supernatant isolated from U2OS cells with LOC100129620 overexpression or knockdown. (B) Quantitative analysis of the Transwell assay results of RAW264.7 cells treated with cell culture supernatant isolated from U2OS cells with LOC100129620 overexpression or knockdown. (C) Transwell assay to detect the invasion ability of RAW264.7 cells treated with cell culture supernatant isolated from MG63 cells with LOC100129620 overexpression or knockdown. (D) Quantitative analysis of the Transwell assay results of RAW264.7 cells treated with cell culture supernatant isolated from MG63 cells with LOC100129620 overexpression or knockdown. (E) Western blot to detect the expression of CD206 in RAW264.7 cells treated with cell culture supernatant isolated from U2OS cells with LOC100129620 overexpression or knockdown. (F) Western blot to detect the expression of CD206 in RAW264.7 cells treated with cell culture supernatant isolated from MG63 cells with LOC100129620 overexpression or knockdown. (G) ELISA to detect the expression of IL-10 in cell culture supernatant isolated from U2OS cells with LOC100129620 overexpression or knockdown. (H) ELISA to detect the expression of IL-10 in cell culture supernatant isolated from MG63 cells with LOC100129620 overexpression or knockdown. (I) The percentages of total (F4/80+) and M2 (CD206+) macrophages in the tumor tissues were assayed by flow cytometry. (J) Statistical analysis of the percentages of total (F4/80+) and M2 (CD206+) macrophages in the tumor tissues. (K) Immunofluorescence analysis of the percentage of M2 (CD206+) macrophages in the tumor tissues. Statistical analysis was conducted using Student’s t-test. Values are means ± SD. **P < 0.01, pLVX-Vector group compared with pLVX-LOC100129620 group; ##P < 0.01, pLKO.1-Vector group compared with pLKO.1-sh1 and pLKO.1-sh2 groups.