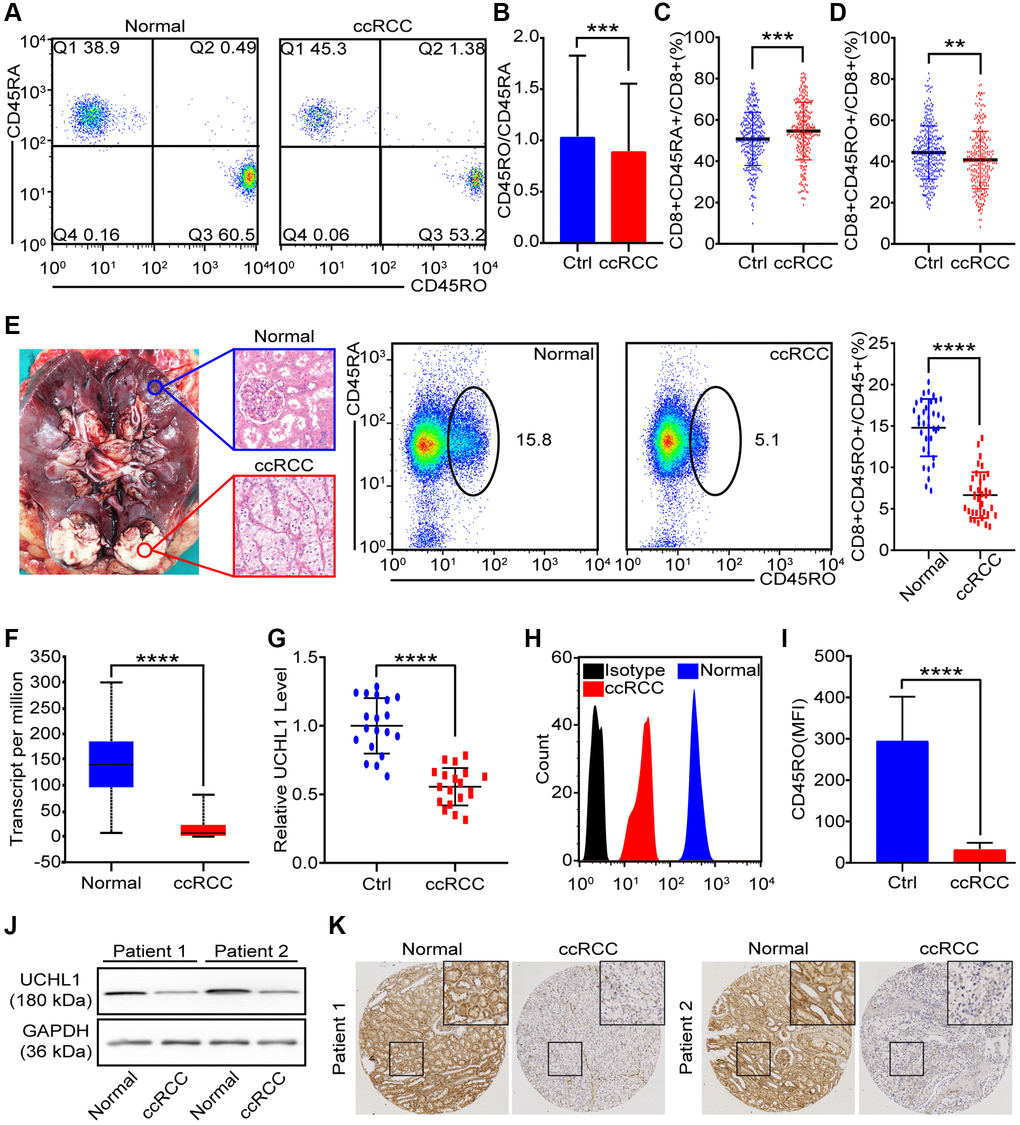
Figure 3.CD45RO+CD8+ T cells decreased in ccRCC tissues. We collected PBMCs and renal tissues to analysis proportion of CD45RO+CD8+ T cells/CD45RA+CD8+ T cells. (A) Flow cytometry representative image of CD45RO+CD8+ T cells/CD45RA+CD8+ T cells from healthy people and ccRCC patients. (B, C) Proportion of CD45RA+CD8+T cells (B) and CD45RO+CD8+ T cells (C) of CD8+ T cells from healthy people and ccRCC patients. (D) Ratio of CD45RA+CD8+ T cells and CD45RO+CD8+ T cells in peripheral blood of healthy people and ccRCC patients. (E) Pathologically confirmed adjacent normal renal tissues (n = 35) and ccRCC tissues (n = 35) were collected and flow cytometry was used to test proportion of CD45RO+CD8+ T cells. (F) Transcript level of UCHL1 (gene name of CD45RO) in normal renal tissues and ccRCC tissues according to TCGA database. (G) Transcript level of UCHL1 in adjacent normal renal tissues (n = 20) and ccRCC tissues (n = 20). (H, I) Flow cytometry was used to test CD45RO fluorescence intensity of CD8+ T cells (H) and MFI was counted (I). (J, K) CD45RO protein levels of adjacent normal renal tissues (n = 35) and ccRCC tissues (n = 35) were tested by western blot and IHC. Means±SEM of experiment performed in triplicates are shown. *P < 0.05; **p < 0.005; ***p < 0.005; ns, not significant.