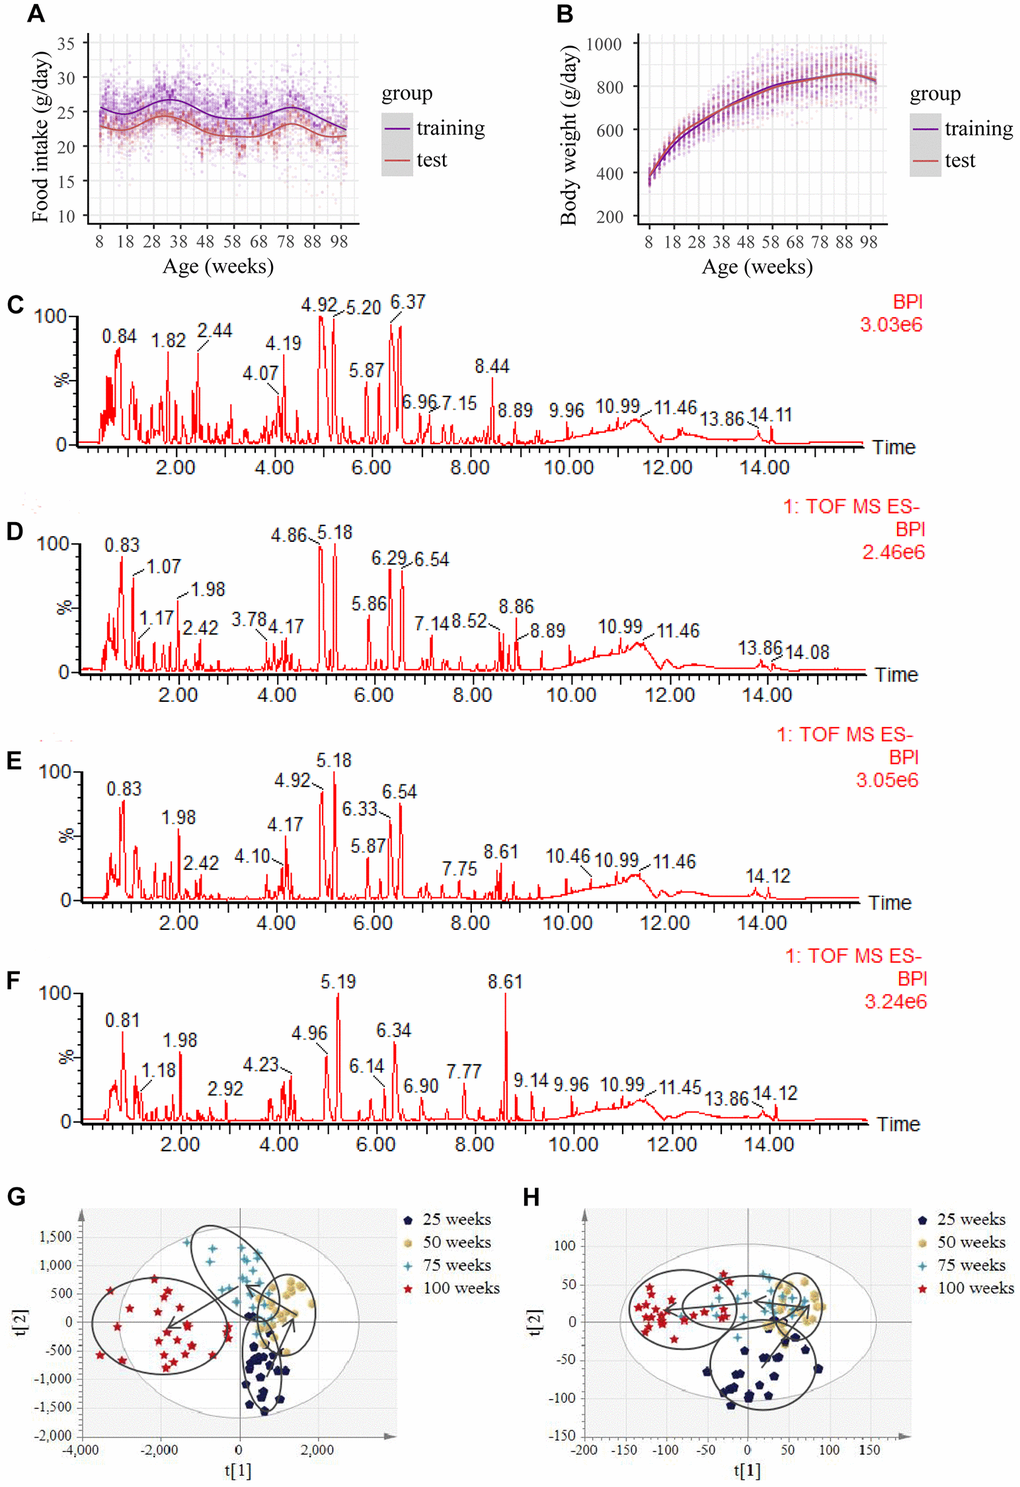
Figure 1.Food intake, body weight, base peak intensity chromatograms and urine metabolic profiles with aging. (A) Food intake in both the training and test group. (Initial sample size: n = 60 in the training group; n = 30 in the test group). (B) Body weight in both the training and test group. (Initial sample size: n = 60 in the training group; n=30 in the test group). (C–F) Representative negative base peak intensity (BPI) chromatograms at the age of (C) 25 weeks, (D) 50 weeks, (E) 75 weeks and (F) 100 weeks of rats using UPLC-Q-TOF-MS in electrospray ionization negative (ESI−) ion mode in the training group. (G–H) PLS-DA scores plots of urine obtained from the UPLC-Q-TOF-MS with age in (G) left: the negative mode, and (H) right: the positive mode in the training group. (n = 24 each time point).