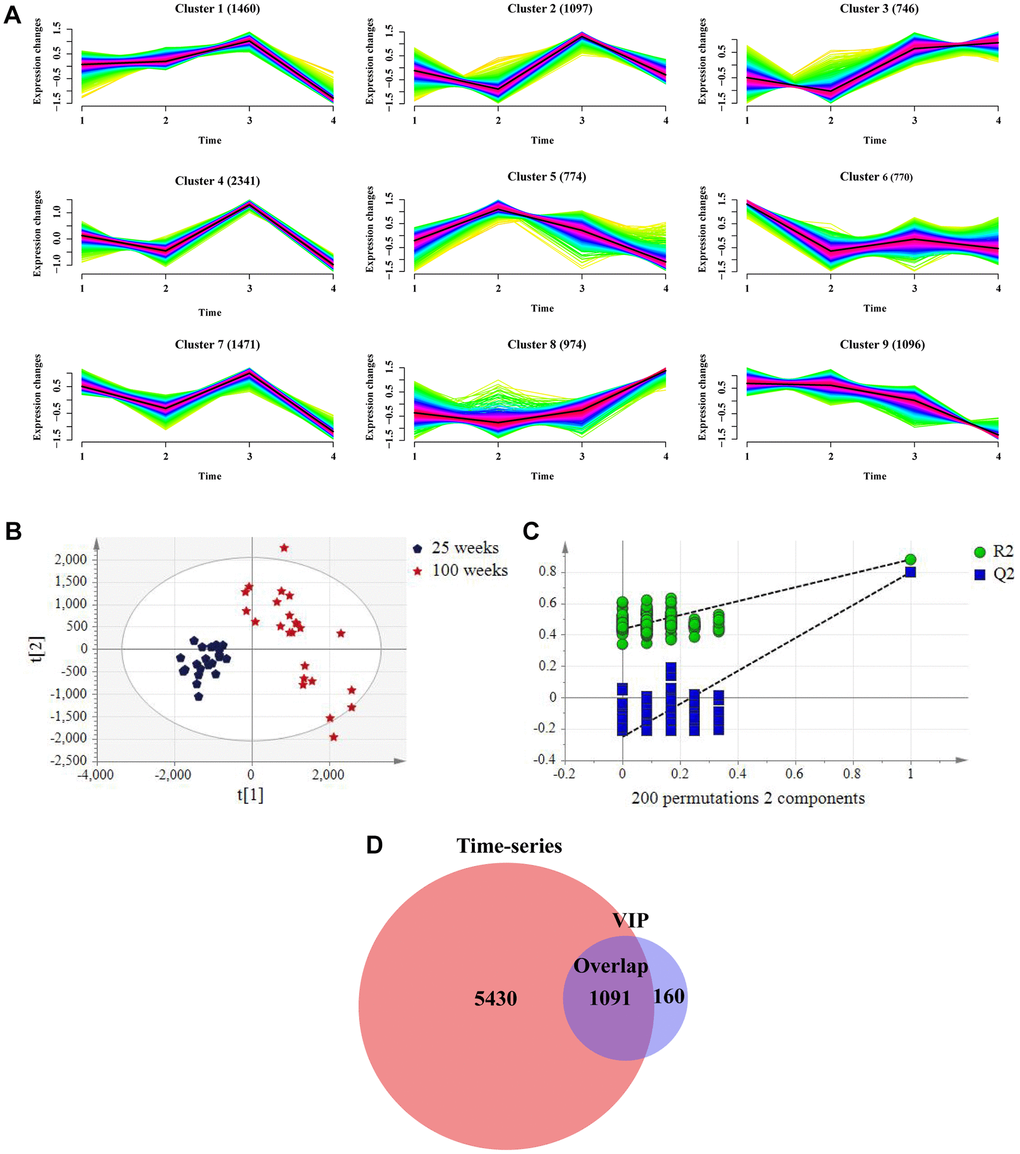
Figure 2.Screening metabolites in combination with time-series analysis and variable importance in the project (VIP) value in the negative mode in the training group. (A) Metabolic aging trajectories. Fuzzy c-mean clustering of all 10729 metabolite abundances. Average trend of clusters is shown as a black line. (B) PLS-DA scores plots of rat urine at 25 weeks and 100 weeks. (ESI−, R2Y= 0.881, Q2 = 0.80). (n = 24 each time point). (C) Permutation test with 2 components of PLS-DA score plot. (D) Venn diagrams demonstrated the overlap of metabolites in combination with two algorithms.