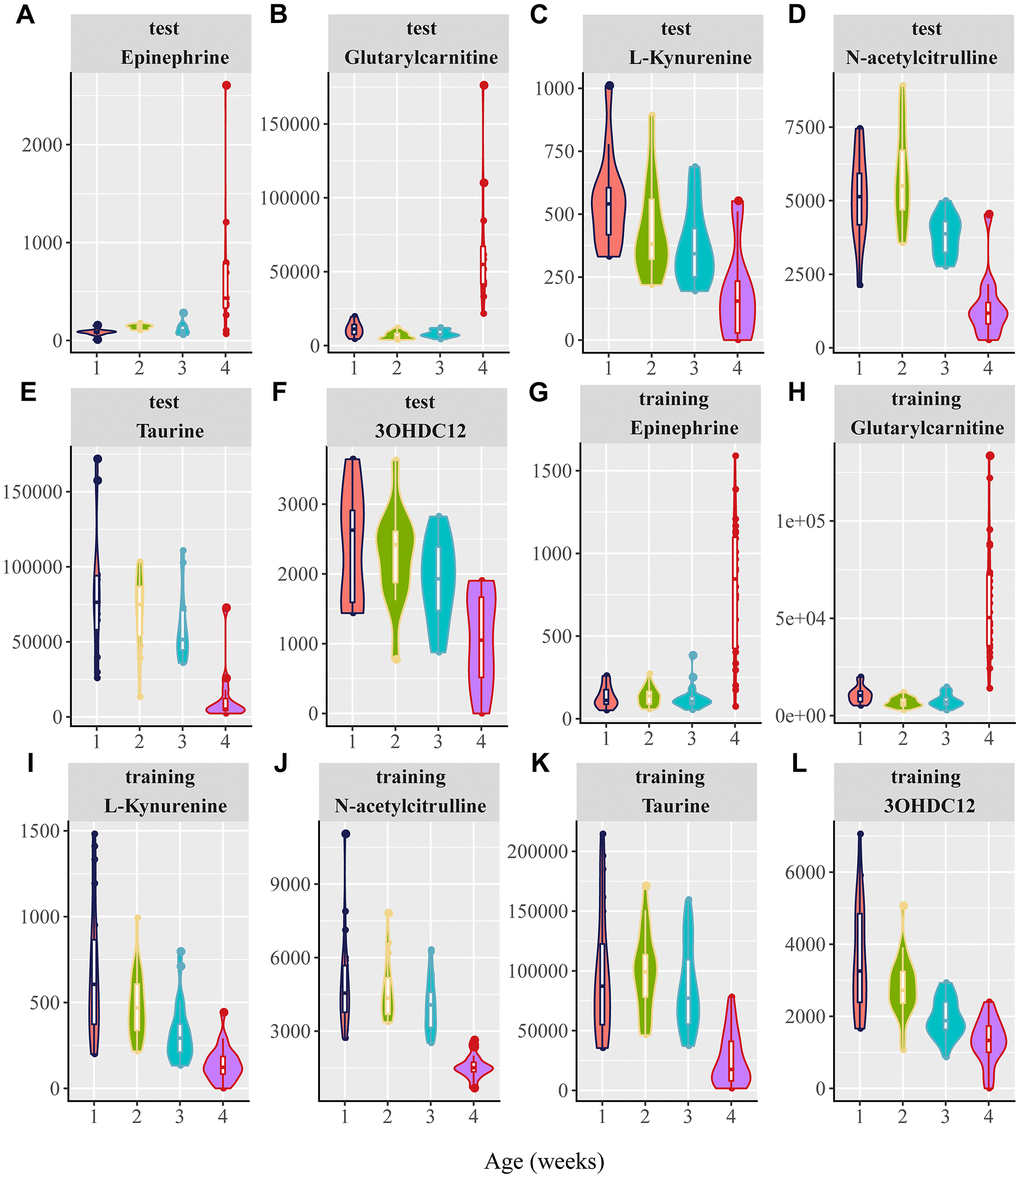
Figure 4.Violin plots for the six potential biomarkers abundance with aging. 1, 2, 3, and 4 in the X axis are represented as 20, 25, 50, 75, and 100 weeks, respectively. (A–F) Normalized abundance of metabolites in both the negative and positive modes in the test group, including (A) epinephrine, (B) glutarylcarnitine, (C) L-kynurenine, (D) N-acetylcitrulline, (E) taurine, and (F) 3-hydroxydodecanedioic acid (3OHDC12). (G–L) Normalized abundance of metabolites in the negative and positive modes in the training group, including (G) epinephrine (H) glutarylcarnitine, (I) L-kynurenine, (J) N-acetylcitrulline, (K) taurine, and (L) 3-hydroxydodecanedioic acid (3OHDC12). (P < 0.0001 for the comparisons between 25 and 100 weeks for the six candidate metabolites in both the test and training groups; one-way ANOVA).